2008
2009
2010
2011
2012
2013
2014
2015
2016
2017
2018
Future
- Biomass
- Coal
- Gas
- Hydro
- Interconnectors
- Nuclear
- Oil
- Solar
- Storage
- Waste
- Wind
In 2008, each kilowatt hour of electricity generated in the UK adds 495 grammes of CO2 to the atmosphere (gCO2/kWh). This important metric – the “carbon intensity” of the electricity system – is to fall by nearly 60% by 2018. For now, electricity demand has been rising for decades and is close to record highs.
Although the face of the UK’s electricity system is starting to change, it is still dominated by large, centralised power plants – many of which were built decades earlier. Just 56 power stations burning coal, gas, oil or nuclear fuel account for the lion’s share of power capacity and generate the vast majority of UK electricity. Coal’s share of generation has halved since the dash for gas in the 1990s, but some four-fifths of UK electricity still comes from fossil fuels – with another 13% from nuclear.
Encouraged by the Non Fossil Fuel Obligation and then the Renewables Obligation, a sprinkling of renewable plants have begun to appear. There are now 552 larger renewable sites – mostly fuelled by hydro, wind and wastes such as landfill gas – and another 3,150 small installations, including 2,400 solar rooftops. [These small sites are aggregated to local authority level and are only shown on the map when they total at least 1 megawatt (MW).] Despite their numbers, renewables supply just 6% of the UK’s electricity.
In January, Medway Council approves a new coal-fired power station at Kingsnorth in Kent. If built, it would be the country’s first for 24 years. The “Kingsnorth six”, who scaled the chimney of the existing Kingsnorth plant to protest against the plans, are acquitted in September.
A new Kingsnorth plant is needed, according to owners E.ON, to meet rising electricity demand and to replace old capacity as it retires. However, demand actually falls for the next decade.
January also sees the Labour government backing a new generation of nuclear power plants, with prime minister Gordon Brown saying the technology “can and will” help to meet climate goals.

In May, the UK is hit by its worst blackouts for a decade after unexpected shutdowns including Sizewell B nuclear plant in Suffolk and the coal-fired Longannet in Scotland. Business secretary John Hutton tells that year’s Labour conference that new coal and nuclear plants are needed to “keep the lights on”. [The following month Hutton is reshuffled.]
In June, opposition leader David Cameron says new unabated coal plants should not be built in the UK. He proposes an emissions performance standard that would limit coal-plant emissions to those of a gas equivalent, requiring the use of carbon capture and storage (CCS).
A new Department of Energy and Climate Change is created in October, with Ed Miliband as secretary of state. One of his first moves is to back “feed-in tariffs” for small-scale renewables, legislated via the Energy Act 2008 along with support for CCS and other measures.
In October, parliament overwhelmingly backs the UK’s Climate Change Act, which sets out a framework of legally binding emissions-reduction goals. The Act creates the Committee on Climate Change to advise government. In its first report, the newly formed committee says:
“There is…a strong case for…establishing a clear and publicly stated expectation that coal-fired power stations will not be able to generate unabated beyond the early 2020s.”
In December, the EU finalises its “20-20-20” strategy on cutting emissions to 20% below 1990 levels by 2020, while improving energy efficiency by 20% and getting 20% of energy from renewables. This includes a 15% renewable energy goal for the UK.
During 2009, the carbon intensity of UK electricity falls 10% to 446gCO2/kWh, after nuclear plants return from a series of outages the previous year.
Along with falling demand due to the recession, coal’s share of the electricity mix shrinks to 27%. Another 50 large renewable sites are built, raising their number to 600 and their share of the electricity mix to 7%.
In January, David Cameron’s opposition Conservatives launch an energy green paper proposing “at least 5,000MW of new coal-fired plants” incorporating CCS technology. The paper also says “we believe that both onshore wind and offshore wind have a significant role to play”.
Writing in the Times in April, energy and climate secretary Ed Miliband says the UK must pursue a “trinity” of low-carbon electricity sources: renewables, nuclear and fossil fuels with CCS. That month, his department says new coal plants will only be allowed if fitted with CCS technology.
In May, the first three five-yearly carbon budgets for the UK are set in law under the Climate Change Act. Emissions are to be cut to 25% below 1990 levels during 2008-2012, by 31% for 2013-2017 and 37% during 2019-2023.
In July, the government launches its “low-carbon transition plan” to meet the UK’s emissions goals. It says 40% of electricity should be low-carbon by 2020 and “around 30%” should be renewable. The first CCS demonstration is to operate by 2014. The next month, a frontpage article in the Daily Telegraph says “Britain [is] facing blackouts for [the] first time since [the] 1970s”. Despite a surge in similar articles over the next five years, no blackouts occur.
In September, a progressive EU ban on incandescent lightbulbs starts to kick in. The move had sparked a Daily Mail front page in January lamenting the loss of “beloved lightbulbs”. The ban goes on to cut peak demand by the equivalent of roughly two nuclear plants.

In October, energy firm E.ON postpones its plans to build a new coal plant at Kingsnorth in Kent, leading protestors to claim their “biggest victory” for the UK climate movement. E.ON blames its decision on weak electricity demand due to the recession, but says it is still competing for a share of government funding to build a CCS demonstration plant on the site.
In December, the UN climate talks in Copenhagen end in “failure”. [This verdict is later challenged.]
In 2010, the carbon intensity of UK electricity rises marginally to 457gCO2/kWh as below-average wind and rainfall suppress renewable output.
In January, the Crown Estate announces the results of its “round 3” licensing for up to 32 gigawatts (GW) of offshore wind in nine development zones around the UK. The UK offshore wind fleet grows by two-fifths to 1.3GW. It had already become the world’s largest in late 2008.
Feed-in tariffs (FiTs) begin to support small-scale renewables from April, leading to a surge in capacity. The number of small wind, solar and hydro schemes leaps fivefold from around 5,000 in 2009 to 27,000 in 2010. By 2011, there are more than 200,000 projects supported by FiTs.
Nevertheless, a government target to get 10% of UK electricity from renewables is missed, in part due to low wind speeds and little rain (the threshold goes on to be crossed two years late).
In May, the Labour government loses power after 13 years. A Conservative-Liberal Democrat coalition takes office, with David Cameron as prime minister. In one of his first acts at the head of government, Cameron visits the Department of Energy and Climate Change and pledges to lead the “greenest government ever”, in a speech delivered to officials while standing on a desk. The coalition agreement signals the introduction of a minimum “floor price” for carbon emissions.

In June, new chancellor George Osborne announces a Green Investment Bank to help “bring forward private investment in clean energy”. The idea has been in development since 2008 and was backed by the then Labour government earlier in 2010. Osborne’s budget also announces a “Green Deal” scheme to boost home energy efficiency. It launches in 2013 alongside wider reforms to energy efficiency policy. The number of efficiency improvements subsequently plummets and the Green Deal is later judged a failure.
June also sees Ayrshire Power submit plans to build a £3bn coal plant with CCS at Hunterston in Scotland. In October, E.ON formally ends plans for a new coal plant at Kingsnorth in Kent, pulling out of a £1bn competition for government CCS funding that it had hoped to win. The competition is later scrapped altogether.
Towards the end of the year, the coalition government launches a consultation on major reforms to the electricity market.
In 2011, the carbon intensity of electricity generated in the UK falls by 4% to 441gCO2/kWh. Renewables’ share of the UK mix climbs to around 10% as wind output jumps by more than half.
In March, the Treasury publishes its “levy control framework” on limiting the low-carbon electricity subsidies that are added to consumer bills. The framework is later used as justification for subsidy cuts, even as its internal logic starts to crumble.
In April, the 1,000MW “BritNed” electricity interconnector opens between the UK and the Netherlands. It joins the 2,000MW link to France, which opened in 1986, and a 500MW link between Great Britain and Northern Ireland.
In May, the coalition agrees the fourth carbon budget target of cutting emissions in half by 2023-2027, compared to 1990 levels. The budget has been subject to “a bit of a war” between the Treasury and DECC, with DECC ultimately securing the target in line with CCC advice.
In June, the government publishes a series of “national policy statements” on energy infrastructure. The statement on nuclear power identifies eight sites as suitable for new reactors, to be built “before the end of 2025”. BBC News reports the announcement, noting it comes “three months after the Fukushima disaster in Japan”.
In July, the government’s “electricity market reform” (EMR) plans are published in a white paper that targets “secure, affordable and low-carbon electricity”. This warns that 20GW of capacity – a quarter of the UK total – is to close within a decade, “increasing the likelihood of blackouts”. It proposes new “contracts for difference” (CfDs) to support low-carbon generation via competitive auctions, as well as a “carbon price floor” – a minimum cost for power-sector emissions – and a “capacity mechanism” to guarantee security of supply.
Alongside the EMR white paper, the “renewable energy roadmap” explains how the UK government will meet the EU target of a 15% renewable energy share by 2020. It sets a target for the cost of offshore wind to fall to £100 per megawatt hour (MWh) by 2020. This target later becomes a benchmark for the cost of the Hinkley C new nuclear plant.
In December, the government publishes its “carbon plan” for meeting the fourth carbon budget. It says most coal-fired power stations will close by 2020 and asks: “Will wind, CCS or nuclear be the cheapest method of generating large-scale low carbon electricity?” Renewable costs go on to fall far faster than expected such that nuclear is – in the words of business secretary Greg Clark in 2019 – “outcompeted” on price. Debate shifts towards grid integration, the benefits of a mix of different technologies and the need to cope with extended periods of low wind generation.
In 2012, the carbon intensity of UK electricity generation leaps by 10% to 484gCO2/kWh, as market prices drive a switch from gas to coal. The dirtiest fossil fuel generates 39% of the UK mix, up from 30% in 2011 and its highest share since 1996.
In January, Conservative backbencher and anti-wind campaigner Chris Heaton-Harris organises a letter to the prime minister demanding a “dramatic” cut in subsidies for “inefficient and intermittent” onshore wind. It is signed by more than 100 other MPs, mostly also Conservatives. The coalition government is “at war” over onshore wind for much of the year, with Conservative energy minister John Hayes sparking front pages in the Daily Telegraph (“Death knell for wind farms”) and the Daily Mail (“Minister signals end of the wind farm”).

In February, Oldbury nuclear power plant closes down after 44 years. The site in Somerset was the world’s oldest operating nuclear plant, having opened in 1967.
In October, a report for the “libertarian” US thinktank the Reason Foundation reflects a widespread talking point by arguing there is a 10% “practical upper limit” to the share of electricity generated by windfarms. The report, later republished with the free-market UK thinktank the Adam Smith Institute, cites barriers including the need for storage and a “decrease in grid reliability”. UK wind goes on to comfortably surpass this supposed limit in 2015, without incident.
In December, two major power plants close after choosing not to upgrade to meet EU air pollution rules under the Large Combustion Plants Directive. One is the 1.9GW Kingsnorth coal plant in Kent, where protestors had scaled the chimney in 2007. The other is the oil-fired 1.3GW plant at Grain, also in Kent. They are followed by four more closures during 2013, totalling 5.1GW.
Around the same time, two large gas plants are completed: a 2.2GW site at Pembroke on the coast of south Wales and a 1.3GW station at West Burton in Nottinghamshire. The latter is occupied by “No Dash for Gas” protestors, delaying the start of operations into 2013. The new sites join four other large gas plants that had opened in 2010. These are the Severn Power site in Wales, Staythorpe C in Nottinghamshire, Langage in Devon and the Grain combined heat and power scheme in Kent. These take the total of new gas capacity to 8.4GW opened in the space of just three years. (Some 8GW of large new gas plants had opened in the decade to 2010.)
The government’s new “gas generation strategy” says up to another 26GW of new gas-fired power stations could still be needed by 2030 “in part to replace older coal, gas and nuclear plant as it retires”. The strategy – unveiled by chancellor George Osborne while energy and climate change secretary Ed Davey is at a UN summit in Doha – is linked to support for fracking and says as much as 37GW could be needed if climate goals are relaxed. This level of new gas is branded “completely incompatible” with UK carbon budgets by the head of the CCC, who does however support the 26GW scenario. [Only one large new gas plant goes on to be built by 2019.]
In 2013, the carbon intensity of UK electricity generation falls to 452gCO2/kWh after another sharp increase in output from the country’s expanding fleet of windfarms.
There are now more than 1,000 large renewable energy schemes across the UK – double the number in 2008 – and nearly half a million small sites, mostly solar rooftops. With nuclear, a third of UK electricity is now low-carbon.
In April, the UK’s carbon price support is introduced at £5 per tonne of CO2 for emissions from the power sector, paid in addition to the cost of the EU Emissions Trading System. At least initially, it is disliked by industry, consumer and green groups. Moreover, despite the measure raising their costs relative to gas-fired power stations, coal plants retain a 35% share of the UK mix in 2013.
Indeed, many gas plants sit idle across Europe, or have been temporarily taken out of service (“mothballed”). Weak demand and the rise of renewables is hitting utility firm profits. Since 2008, the top 20 European utilities have lost “half a trillion euros” – or half their value.
Later in April, the UK’s largest power plant at Drax in Yorkshire converts one of its six units to burn biomass wood pellets instead of coal. It goes on to convert four of the six units to use the fuel, which is kept dry in giant golf-ball shaped storage domes. That year, former coal plants at Ironbridge in Shropshire and Tilbury in Essex are also running on biomass. They close soon after.
In July, prime minister David Cameron opens the world’s largest offshore windfarm, the 630MW London Array in the Thames estuary. It holds the title for five years.
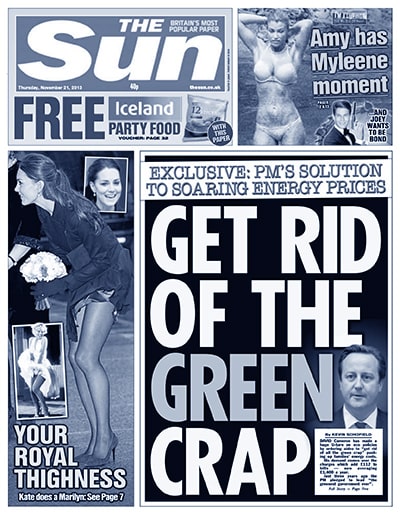
At the Labour conference in September, opposition leader Ed Miliband says rising household energy bills should be frozen, an idea Cameron brands as “Marxist”. (His Conservative successor, Theresa May, goes on to adopt a similar policy.) Later in the year, a Sun front page splash suggests Cameron has his own solution to rising bills: “Get rid of the green crap.” His government cuts support for the energy efficiency measures that have helped limit increases, leading to a 90% fall in the rate of improvements.
The Liberal Democrat conference votes in favour of a new generation of nuclear power plants. Lib Dem energy and climate secretary Ed Davey had said it would be “reckless” to oppose new nuclear in the face of a warming planet. The next month, the government signs a deal with French energy giant EDF to build the Hinkley C new nuclear plant for £92.50/MWh. It will be the UK’s first new nuclear plant since Sizewell B was completed in 1995.
In December, the Energy Act 2013 receives royal assent, enacting the coalition’s “electricity market reforms” of competitive auctions for low-carbon power and a capacity market to secure supplies.
In 2014, the carbon intensity of UK electricity generation drops 11% to 401gCO2/kWh – a record low – as coal’s share of the mix falls back below 30%.
There are just 13 large coal or oil-fired power stations remaining in the UK, down from 19 in 2008. Renewables now supply a fifth of UK electricity – more than nuclear for the first time – from more than 600,000 small installations and 1,400 larger sites.
In his March budget, chancellor George Osborne announces a freeze in the UK’s top-up carbon tax, the carbon price support, which had been due to rise steadily until at least 2020. The freeze kicks in only after the tax increases to £9/tCO2 in April and then doubles to £18/t in April 2015, helping drive rapid declines in coal-fired electricity generation.
Meanwhile, demand for electricity defies the experts by continuing to fall, due to a poorly-understood mixture of energy efficiency policy, higher prices and other factors. Declining per-capita demand for electricity goes on to become the largest source of cuts in power sector carbon emissions, just ahead of renewables and far above gas.
In April, the government agrees to support eight renewable energy schemes, totalling 4.5GW, under its new “contracts for difference” (CfDs) regime. The projects are awarded contracts without competitive auction, leading to criticism from government auditors.
In October, EU leaders reach a compromise deal on climate goals for 2030, including cutting emissions by “at least” 40% relative to 1990 levels while getting 27% of energy from renewables and cutting energy use by 27% relative to the current trajectory. The UK remains well short of its 2020 renewable target.
In December, the first auction is run under UK’s capacity market, designed to ensure there are always enough power stations to meet demand. The same month, small energy firm Tempus launches a legal challenge against the scheme, with the cornerstones of government electricity policy later being deemed illegal as a result.
In 2015, the carbon intensity of electricity drops by 17% to 332gCO2/kWh as coal continues to decline. Renewables increase their share to a record quarter of the overall mix – overtaking coal for the first time – and there are now nearly 800,000 sites around the UK running on wind, solar, hydro, biomass or wastes. This pushes low-carbon electricity up to 46% of the UK mix.
During the year, another five major power plants totalling 8GW close down rather than invest to meet EU air pollution rules. These are the oil-fired Littlebrook D in Kent and coal plants at Lynemouth in Northumberland, Longannet in Scotland, Ironbridge in Shropshire and Ferrybridge C in Yorkshire. (Lynemouth is later converted to burn biomass.)
In February, the leaders of the UK’s three main political parties sign up to a joint pledge on tackling climate change, including an end to unabated coal-fired electricity generation. Later that month, 27 renewable schemes totalling 2.1GW of capacity secure support at the first competitive CfD auction. Prices are far below what had been expected. Meanwhile, UK solar capacity nearly doubles to reach 10GW, as developers rush to beat a subsidy deadline at the end of March.
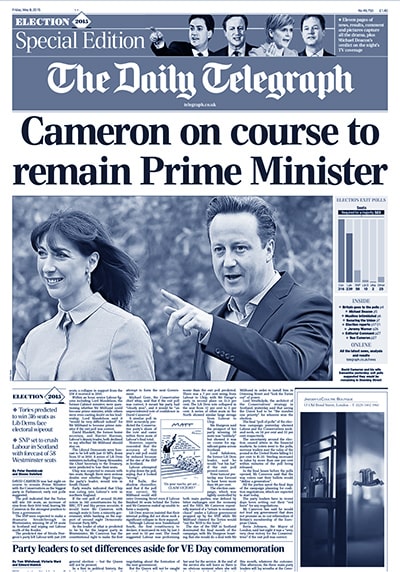
In May, the Conservatives win a surprise majority in the general election, signalling a major change of direction for UK energy policy. In June, new Conservative energy and climate change secretary Amber Rudd gives a statement on “ending subsidies for onshore wind”, after an election manifesto commitment to “halt the spread” of onshore windfarms.
In July, chancellor George Osborne’s budget revokes the Climate Change Levy exemption for renewables. The surprise decision removes what has effectively been a £5 per megawatt hour subsidy to renewables, causing shares in some firms to plunge. The government then unveils a series of subsidy cuts and other restrictions for the cheapest renewable technologies – onshore wind and solar – in what it says is an effort to limit household energy bills. Some of these changes are enacted via the Energy Bill 2015/16.
In November, Rudd announces “a new direction for UK energy policy”. Her “reset” speech shifts the emphasis for UK policy by saying – three times – that “energy security has to be the number one priority”. She also pledges to phase out coal-fired power by 2025 “if we’re confident that the shift to new gas can be achieved within these timescales”. Rudd adds that it is “imperative” for the UK to build more than one new nuclear plant and lends support for “up to 10GW” of offshore wind to be built in the 2020s.
Soon after, the £1bn government competition to support carbon capture and storage is axed.
The COP21 summit in December makes history with the Paris Agreement on climate change. This raises global ambition with a target to keep warming “well below” 2C above preindustrial temperatures and to make efforts to stay below 1.5C. Days later, the UK’s last deep coal mine at Kellingley in Yorkshire closes down.
In 2016, the carbon intensity of UK electricity drops by nearly a quarter to 256gCO2/kWh after coal-fired generation drops by two-thirds. Gas generation fills the gap with its only significant year-on-year increase of the decade, but remains well below levels seen between 2008 and 2010. The decline of coal means it generates less of the UK’s electricity than wind for the first time.
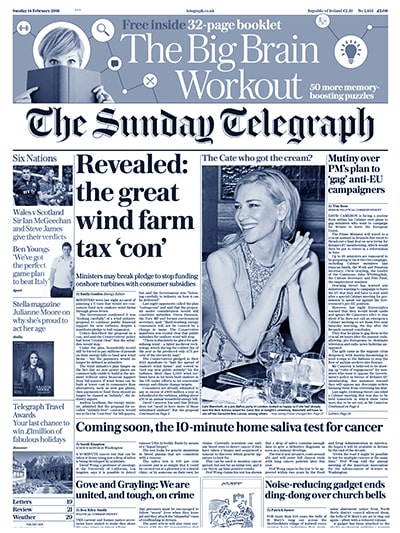
The idea of giving “subsidy free” contracts to windfarms loses momentum after being described in a Sunday Telegraph frontpage splash as “the great wind farm tax ‘con’”. It is never implemented.
In March, the newly formed National Infrastructure Commission says the UK could save up to £8bn a year by 2030 if it embraces the “smart power revolution” overtaking the energy sector, as ageing power stations retire to be replaced by low-carbon sources of electricity.
In April, Carbon Brief analysis reveals the first-ever day where the country’s solar panels generate more electricity than coal. This is quickly followed by the first week, month and half year where solar outstrips coal.
In May, Great Britain experiences its first hours without burning coal to generate electricity since 1882, when Edison’s “Jumbo” started supplying electricity to a local grid at Holborn Viaduct in London. [Northern Ireland is part of the separate all-Ireland “single electricity market”.]
In June, the government puts the UK’s fifth carbon budget into law, requiring a 57% cut in emissions by 2028-2032, compared to 1990 levels. It is immediately clear that the policies to meet this budget are lacking. The next month sees the scrapping of the Department for Energy and Climate Change, which is merged with business and skills to create a new Department of Business, Energy and Industrial Strategy (BEIS).
In September, BEIS gives the go-ahead for the planned 3.2GW Hinkley C new nuclear plants in Somerset. The Wylfa nuclear plant on Anglesey in Wales closes in December. Several more coal plants close down: the 2.3GW Longannet in Scotland and 1GW sites at Ferrybridge C in Yorkshire and Rugeley in Staffordshire.
In 2017, the carbon intensity of UK electricity generation falls to 226gCO2/kWh as coal output continues its rapid decline.
For first time, low-carbon sources generate more than half the UK total, Carbon Brief analysis reveals. This is double their contribution in 2009, when 73% of generation was from fossil fuels. Coal and gas generation both decline, offset by a large increase in the output from windfarms as their capacity rises by a fifth.
In February, Toshiba cancels plans to build a new nuclear plant at Moorside in Cumbria. It was supposed to have been one of six new schemes, along with the Hinkley C plant in Somerset. The next month, analysis from the government’s official advisers show that average household energy bills have fallen since 2008, contrary to the dominant media and political narrative. The chancellor Philip Hammond scraps the government’s “Levy Control Framework” (LCF) – designed to manage the impact of subsidies on bills – in his March spring statement.
In April, Great Britain sees its first full day without coal since 1882. In March, the official opening of the 910MW Carrington site near Manchester marks the first new conventional power station opened in the UK since 8.4GW of gas plants were completed in 2010 and 2012. By 2018, the Department for Business, Energy and Industrial Strategy has dramatically scaled back the outlook for new gas plants to 6GW by 2035.
Prime minister Theresa May calls a snap election for June, hoping to capitalise on a substantial lead in the polls. The Conservatives go into the election with a manifesto pledge to review the costs of energy in the UK, a move widely seen as a prelude to weakening climate goals. Instead, May loses her working majority in parliament and sacks the advisers behind the manifesto. The review of energy costs goes ahead, but its findings fail to spark major changes in policy.
In July, environment secretary Michael Gove announces plans to ban the sale of new petrol and diesel vehicles by 2040. A series of scare stories in the runup to the news inaccurately suggest the UK will need as many as 20 new nuclear plants to cope with the demand from electric vehicles. Negative coverage continues through the summer.
In September, the government announces results from its second “contracts for difference” auction. Two offshore windfarms spectacularly beat expectations, winning contracts for the early 2020s at £57.50 per megawatt hour – cheaper than the projected cost of new gas-fired power. As Carbon Brief notes at the time:
“The auction results [for offshore wind] shift the conversation, from renewables being expensive, towards how cheap, variable zero-carbon power can be integrated into the grid, while maintaining sufficient supplies of power throughout the year.”
In October, the government publishes its long-awaited Clean Growth Strategy setting out how the UK will meet its fourth and fifth carbon budgets for 2023-2032. This includes a new approach to CCS “designed to…ensure the government has the option of deploying CCUS at scale during the 2030s, subject to costs coming down sufficiently”. The policy ambition needed to meet the strategy’s aims are still lacking across the board, according to government advisers.
The budget in November includes a replacement for the LCF – an effective moratorium on new support for low-carbon electricity beyond the already-committed £557m earmarked for offshore wind. The budget leaves the door open to “subsidy-free” support, but this is not pursued.
Reforms to the EU Emissions Trading System (EU ETS) spark a strong increase in carbon prices, putting a further squeeze on coal-fired power stations in the UK and beyond.
In 2018, the carbon intensity of UK electricity generation falls again to just 207gCO2/kWh – a reduction of nearly 60% compared to 495g in 2008 and more than half since 484g in 2012.
There are just seven coal plants remaining in the UK supplying less than 5% of the electricity mix. Gas generation has been ever-present and meets nearly 40% of UK demand – but its output has declined, too, falling 25% since 2008. Nuclear still supplies around a fifth of the total.
Coal capacity has shrunk from 32GW in 2008 to just 12GW, with another 2GW set to close in 2019. In contrast, the UK’s wind and solar capacity has exploded. Solar has gone from being close to zero in 2008 to 13GW, while wind has increased six-fold from 3.6GW to nearly 22GW. The capacity of the country’s gas and biomass power plants has also gone up by around 5GW each. Meanwhile, more than 700 megawatts (0.7GW) of battery storage capacity has been built in the space of two years, with another 220MW in the pipeline.
In 2008, just 56 major power plants burning coal, oil, gas or nuclear fuel generated the vast majority of UK electricity and the roughly 500 large renewable sites around the country contributed only 6% to the mix. Now, there are nearly 3,000 large renewable schemes and more than 800,000 small sites, collectively generating more than a third of the mix.
In March, the iconic chimney stack at the former Kingsnorth coal plant in Kent is demolished, a decade after it had been scaled by anti-coal protestors. Later in the year, the 660MW Walney offshore windfarm opens off the coast of Cumbria, overtaking the London Array to become the world’s largest.
The Committee on Climate Change, the government’s official climate adviser, publishes two significant reports. One suggests the UK should “move away” from the large-scale burning of biomass to generate electricity, once existing subsidy contracts for sites such as Drax in Yorkshire and Lynemouth in Northumberland expire in 2027. The other says it could be cheaper to build new renewables in the 2020s than to keep running existing gas plants.
Meanwhile, the National Infrastructure Commission says a “quiet revolution” in renewable costs means government should prioritise wind and solar, alongside energy efficiency, as it looks to the low-carbon economy of the future. In June, the government agrees a “sector deal” with the nuclear industry, which commits to “reduce the cost of new nuclear build projects by 30% by 2030”. [It does not say what this is compared to.]
In November, business secretary Greg Clark gives a speech proclaiming the imminent “end of the trilemma”. The trilemma was the idea that electricity supplies can meet only two out three competing priorities: cheap, secure or low-carbon. This trade-off will be “well and truly over” by the mid-2020s, Clark says, as “green power will be the cheapest”.
The shift in rhetoric continues when Clark explains to parliament in early 2019 why the Wylfa new nuclear plant in Wales will not be going ahead despite strong continued government support for the technology. Clark says:
“The economics of the energy market have changed significantly in recent years. The cost of renewable technologies such as offshore wind has fallen dramatically…The challenge of financing new nuclear is one of falling costs and greater abundance of alternative technologies, which means that nuclear is being outcompeted.”
In the first half of 2019, Great Britain extends its record for running without coal-fired electricity, first to one week, then two weeks, then 18 days in a stretch.
The past decade of transformation in the UK’s electricity sector is a prelude to much greater change in the years to come, as the country moves towards the zero-carbon grid that will be needed to meet a recommended long-term climate goal of reaching net-zero emissions by 2050.
Since 2008, electricity demand has fallen to its lowest level in decades, thanks to energy efficiency policies and other factors, easing the transition away from fossil fuels. Nuclear has held steady while renewables have come of age, now generating a third of UK electricity. Coal has all but disappeared. Gas continues to be an essential part of the mix, even as it too has declined.
By 2025, the UK’s last coal-fired power station will have closed and by the 2030s all but one of the UK’s existing nuclear plants is due to have retired. Only one new nuclear plant – Hinkley Point C in Somerset – is currently being built. Meanwhile, some 1GW of onshore windfarms could retire by 2030 and would need to be “repowered” with new turbines or their output replaced elsewhere.
Some 15GW of gas-fired power stations were built before 2000 and are also likely to have retired by 2030. On the other hand, some 30GW of new gas is under development, though much of this remains unconfirmed. Either way, to meet the UK’s climate goals, gas generation will have to decline from its current 40% share down to around 25% of the mix or below.
The gap left by nuclear and fossil fuels will mainly be filled by renewables – chiefly, via the government’s favoured choice of offshore wind. The government-industry offshore wind sector deal has pledged to meet a third of UK electricity demand in 2030, with projects costing less than fossil fuel generation by 2020. This deal, as well as CCC projections, see offshore wind capacity topping 30GW by 2030, with the first new projects already contracted and shown on the “future” map.
A proliferation of new undersea interconnectors will link the UK with other markets, helping to balance supply and demand, even as output from wind and solar plants varies across hours, months and seasons. Some 14GW of new links are planned or already under construction, to countries including France, the Netherlands, Denmark and Norway.
Battery storage sites are also set to quickly expand in the years ahead, from some 0.7GW today to more than 3GW in the early 2020s – with nearly 5GW having already received planning permission, according to trade body RenewableUK.
Yet much remains to be decided by 2030:
- What other low-carbon sources will join offshore wind and the Hinkley C plant as coal and gas decline?
- Will government offer a route to market for the cheapest sources of electricity, onshore wind and solar?
- How will electricity markets be reformed to cope with a future dominated by variable output from renewables?
- Can National Grid fulfil its aim to manage the electricity network without fossil fuels by 2025 – at least for hours at a time?
- And can energy efficiency offset rising demand due to electric vehicles and heat pumps?
In the longer term towards net-zero emissions in 2050, demand is expected to double as heat and transport are electrified. Renewables will be at the heart of this expanded electricity system including, perhaps, 75GW of offshore wind, according to the CCC. It also sees a significant role for CCS and new nuclear to help balance variable wind and solar across the year.
Whatever comes next, the map of the UK electricity system is sure to keep changing.