el-nino hero

Explainer: How the ‘super El Niño’ will reshape the world’s weather

By Robert McSweeney and Daisy Dunne

Design by Tom Prater and Joe Goodman

The world is currently experiencing what is expected to become the strongest El Niño on record – dubbed a “super El Niño” by many.

El Niño is the warm phase of a recurring climate pattern in the tropical Pacific that releases heat from the ocean into the atmosphere.

This temporarily raises global temperatures and reshapes rainfall and extreme weather around the world – impacting the lives of billions of people.

The current El Niño event began in June and is expected to last into 2027.

El Niño is part of a wider climate pattern called the El Niño-Southern Oscillation (ENSO) cycle.

The ENSO cycle also has a cool phase, known as La Niña, as well as a “neutral” phase. El Niño and La Niña events typically last between nine and 12 months, but can go on longer.

Below, Carbon Brief explains how the ENSO cycle works, its impacts on extreme weather and global temperatures and why this El Niño event is projected to be the most intense since records began.
Dynamic background

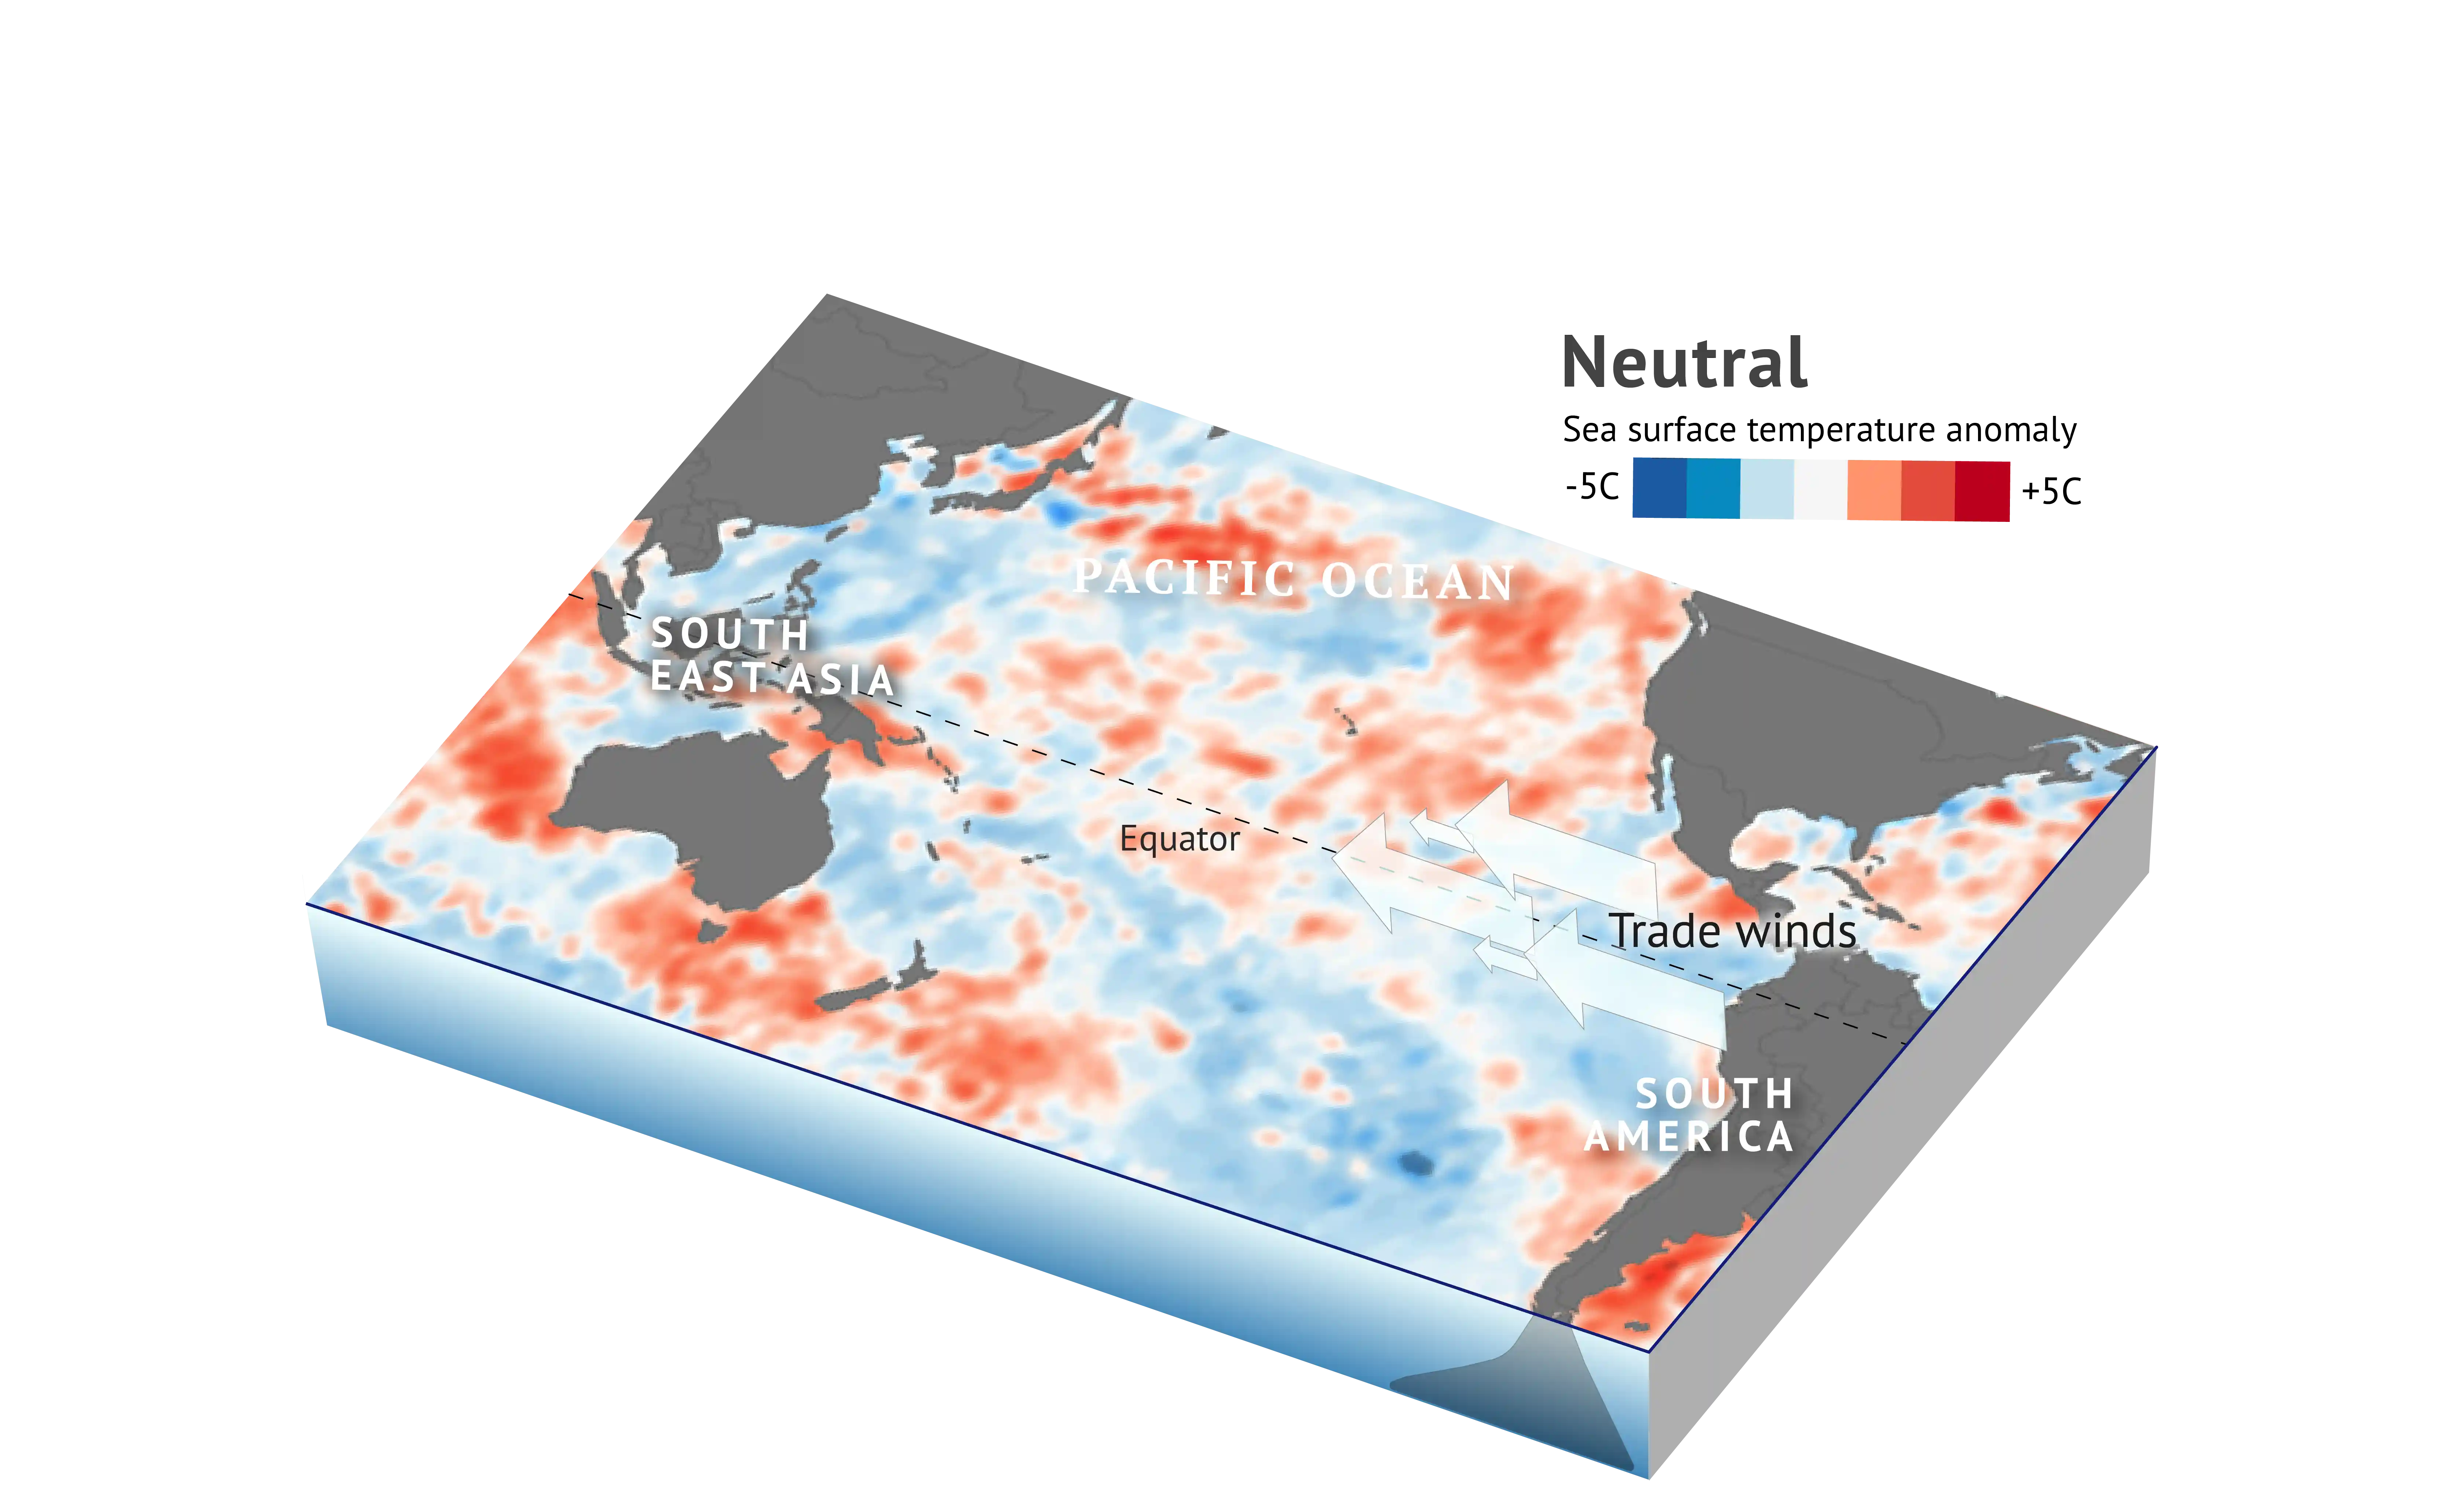
Source: NOAA OISST data (1 Dec 1989)

Neutral conditions

Under “neutral” conditions, the trade winds blow from east to west across the tropics. These winds are driven by a combination of warm air rising along the equator and the rotation of the Earth.

The trade winds push warm surface water from South America towards Asia. In its place, cold water is drawn up from the deeper ocean off the South American coast – a process called “upwelling”.

This nutrient-rich water makes the region one of the world’s most productive fishing grounds. Peru’s anchovy fishery, for example, is the largest in the world by volume.

Rainfall patterns reflect the surface water temperatures. The warm waters in the western Pacific fuel heavy rainfall across Indonesia and the islands of south-east Asia.

In contrast, the cool waters in the eastern Pacific suppress rainfall, bringing dry conditions to South America’s west coast.

The contrast in warm and cold waters is closely linked to a “seesaw” in air pressure differences across the Pacific. This pattern is known as the “Southern Oscillation” and is tracked by comparing the air pressure in the Pacific island of Tahiti and the city of Darwin in northern Australia.

How an El Niño event develops

During an El Niño event, the Pacific trade winds weaken – or even reverse locally – allowing the warm surface water to spread back towards South America, suppressing ocean upwelling.

This reduces the contrast in sea surface temperatures, weakening the air pressure differences across the equatorial Pacific. This further reduces the trade winds, causing a positive “feedback loop” that amplifies the event.

As the warm waters shift, so do the rainfall patterns, typically bringing very wet conditions to the west coast of South America and leaving south-east Asia unusually dry.

The shift in winds over the Pacific also has knock-on impacts for weather around the world.

How a La Niña event develops

During a La Niña event, the opposite occurs. Rather than weaken, the trade winds strengthen.

This pushes the warm surface waters into the far western part of the tropical Pacific and increases the upwelling of cold water.

Cooler-than-average surface waters extend further west into the tropical Pacific, strengthening the temperature and pressure gradients across the ocean.

A La Niña amplifies rainfall patterns seen in a neutral year, bringing heavier rainfall to south-east Asia and cooler and drier conditions to the west coast of South America.

The history of El Niño

The cycles of El Niño and La Niña have been affecting the Earth for millennia. A study of proxy data from preserved corals, for example, suggests that ENSO-like variability has existed for at least 130,000 years.

Historical records suggest that Peruvian fisherfolk had recognised El Niño events by at least the 1600s, when a warm southward-flowing current would replace the normally cold, nutrient-rich waters off Peru’s coast.

They named the warm current “El Niño de Navidad” – or the “Christ Child” – because it was most noticeable around Christmas.

In 1926, British scientist Gilbert Walker coined the term “Southern Oscillation” for the periodic change in atmospheric pressure between the east and west tropical Pacific.

And then, in the 1960s, Swedish-born meteorologist Jacob Bjerknes joined the dots between El Niño and the Southern Oscillation, establishing the concept of the ENSO phenomenon.

Defining the ‘strength’ of an event

Scientists identify an emerging El Niño or La Niña event by monitoring sea surface temperatures – using ships, buoys and satellites – in the Pacific Ocean.

Typically, they focus on the “Niño3.4” region, a rectangular section of the central Pacific covering more than 6m km2, centred on the equator.

(Other regions of the tropical Pacific are also used to monitor El Niño, with Niño 1+2 in the east and Niño 4 in the west.)

The traditional Oceanic Niño index (ONI) tracks how far conditions in Niño3.4 depart from average on a three-month running average.

Sustained ONI values of at least +0.5C indicate El Niño conditions. When they drop to -0.5C, a La Niña event is potentially on the way. Anything in between is considered “neutral”.

Different organisations have slightly different criteria for declaring that an El Niño or La Niña event is underway.

The US National Oceanic and Atmospheric Administration (NOAA), for example, requires El Niño or La Niña conditions to have persisted, or be expected to persist, for five consecutive overlapping three-month periods.

NOAA’s criteria also take into account atmospheric indicators, such as shifting trade winds and rainfall patterns.

(In 2026, NOAA switched to using the relative ONI, which works in a similar way to the ONI, but accounts for the background warming of the tropical Pacific.)

The impacts of an El Niño event

El Niño impacts temperatures and rainfall around the world, raising the risk of extreme weather events in many regions.

El Niño: South-east Asia and South America

South-east Asia and South America are particularly impacted by El Niño.

In central and South America, El Niño typically brings warmer and drier weather to the northern and tropical parts of the continent – and heavy rainfall to the south.

The change in conditions means that countries such as Colombia, Venezuela and northern Brazil face a higher risk of drought and wildfires, while southern Brazil, central Chile and northern Argentina often experience severe flooding.

In south-east Asia and parts of Australia, El Niño usually brings drier conditions – raising the risk of severe drought and wildfires.

El Niño: Asia

In India, El Niño can drive extreme heat in the first few months of the year, before increasing the risk of drought in the later months by weakening the summer monsoon.

Parts of Asia can also experience warmer than usual conditions at the beginning of the year, including China and Japan.

El Niño: Africa

In Africa, El Niño can raise the risk of dryness and drought in countries in the southern part of the continent from December to February – and bring flooding in eastern nations.

El Niño: North America

In North America, El Niño can bring milder winter temperatures to north-west Canada and the US, while increasing winter storms and flooding in southern US states and California.

El Niño: Tropical storms

Because of its impact on atmospheric circulation and sea surface temperatures, El Niño alters the formation, timing and distribution of tropical storms around the world.

In North America and the Caribbean, El Niño can lead to a quieter Atlantic hurricane season. (In the North Atlantic ocean, tropical storms are called hurricanes.)

This is because El Niño’s impact on atmospheric and ocean conditions can increase vertical wind shear in the tropical Atlantic and Caribbean seas. These powerful winds tear apart developing storms, suppressing the development of hurricanes.

In other parts of North America, including southern US states and California, El Niño can bring more intense winter storms. This is due to El Niño’s impact on the jet stream – a current of fast-flowing air high up in the atmosphere affecting weather in mid-latitude regions.

During El Niño, the weakening of trade winds causes warm water from the western Pacific to shift eastwards. This also shifts the area of tropical storm formation to the east.

In Asia, the eastward shift means that tropical storms – known as typhoons in this region – are less likely to move towards the Philippines and are instead more likely to affect China, Japan and South Korea.

Because of the eastward shift, typhoons typically have longer to travel before making landfall. This gives them more time to gather heat and moisture, increasing their chances of becoming major, destructive storms.

For islands in the central and eastern Pacific Ocean, such as Hawaii, Kiribati and Tuvalu, the warmer sea temperatures can bring more frequent and intense tropical storms.

The impacts of a La Niña event

The impact of La Niña on temperatures and rainfall in different parts of the world is roughly the opposite of that of El Niño.

La Niña: South-east Asia and South America

South-east Asia and South America are particularly impacted by La Niña.

In central and South America, La Niña typically brings wetter weather to the northern and tropical parts of the continent, raising the risk of floods in countries such as Colombia, Venezuela and northern Brazil.

In southern parts of the continent, such as southern Brazil and northern Argentina, La Niña can bring severe dry conditions, raising the risk of drought.

In south-east Asia and north-east Australia, La Niña is associated with above-average rainfall, often driving severe flooding and landslides.

La Niña: Africa

In Africa, La Niña can bring increased rainfall and a higher risk of floods in southern parts of the continent from December to February, but dry weather and drought risks in east Africa.

La Niña: North America

In North America, La Niña can bring colder and wetter winters in north-west Canada and the US – and drier and hotter winters in southern US states and Mexico.

How El Niño affects global temperature

An El Niño event typically gives a temporary boost to global temperatures.

The weakening trade winds allow warm surface waters to spread across the Pacific Ocean, releasing heat into the atmosphere.

In general, a 1C temperature shift in the Niño3.4 region is associated with around a 0.1C change in global average temperature, with a lag of between three and six months.

As a result, major El Niño events have contributed to record-breaking annual global temperatures, including in 1998, 2016 and 2024.

In contrast, during a La Niña event, the strengthening trade winds promote the upwelling of cold water in the eastern Pacific, which has a cooling influence on global temperatures.

El Niño and La Niña are generally the largest drivers of year-to-year variability in global temperatures. But this influence is only temporary.

Ongoing human-caused global warming has meant that new global temperature records set in El Niño years have typically been short-lived.

In the ERA5 temperature dataset, for example, 1998 was a record warm year at the time, but it was subsequently topped by 2005. That record was then surpassed in 2010, which was then eclipsed by 2015, 2016, 2023 and 2024.

Removing the influence of El Niño and La Niña from the global temperature record highlights how these events can cause more severe peaks and troughs from one year to the next.

But, ultimately, human-caused climate change is the key driver behind record-breaking global temperatures.

The 2026-27 ‘super El Niño’

Earth is currently experiencing an El Niño event, which began in June and is expected to last into 2027.

Many forecasts suggest that this El Niño could be the strongest on record, causing severe impacts globally. Because of this, many media outlets and commentators are calling this event a “super El Niño” – although this is not a recognised scientific term.

Carbon Brief analysis of forecasts from 14 different modelling groups that track El Niño globally – updated with the latest data – finds that 96% of runs predict that this event will be the strongest in the modern observational record.

This means that the models predict that the peak sea surface temperature “anomaly” in the Niño3.4 region will exceed the previous record of 2.75C, set during the El Niño event of 2015-16. (An “anomaly” is the difference between current conditions and the long-term average.)

This chart shows forecasts made by models for sea surface temperatures in the Niño3.4 region for 2026 and into 2027. Each month on the x-axis represents a three-month average.

How might climate change affect El Niño?

With a possible “super El Niño” forecast for 2026-27, there has been renewed interest in whether climate change is making such events more likely.

The potential influence of climate change on El Niño is an area of active scientific debate.

The latest assessment from the Intergovernmental Panel on Climate Change (IPCC), published in 2021, said that the intensity of El Niño, along with the frequency of high-magnitude events, has increased since 1950, when compared to periods in the past stretching back to 1400.

However, “proxy” data of Earth’s past climates, from tree rings to sediment cores, shows that El Niño events have varied widely in their frequency and intensity over the past 11,000 years – making it difficult to attribute the recent changes to human-caused warming.

The uncertainty also makes it difficult to assess how El Niño events could change in the future. One study from 2017 projected that El Niño could double in frequency at 1.5C of global warming, the aspirational temperature target of the Paris Agreement.

More recently in June 2026, the New York Times spoke to 16 climate scientists about the likelihood of warming influencing the ENSO cycle, of which eight said “they see compelling evidence that climate change is likely increasing the intensity of El Niño events”.