The Paris Agreement’s long-term goal of keeping warming “well below” 2C and aiming to limit it to 1.5C is the global benchmark for climate action.
It was conceived to avoid the worst impacts of global temperature rise and minimise the risks – and costs – of reaching even higher warming levels.
Yet, the world is currently on a path to warming that is double the aspirational 1.5C limit. Continuing mitigation efforts in line with existing climate policies would see a 66% chance of warming reaching 3C this century.
In its 2022 report, the Intergovernmental Panel on Climate Change (IPCC) explored thousands of possible climate futures – including those that do limit warming to 1.5C, both with and without a temporary temperature “overshoot”.
These different modelled pathways provide insights into possible future greenhouse gas (GHG) emissions and temperature trajectories, depending on the many choices that global society makes.
The interactive below unpacks what future levels of emissions could mean for global average temperatures, if – or when – the Paris Agreement’s 1.5C limit might be breached, and, in some cases, by how much and for how long.
1.5C no/limited overshoot
Temperature relative to 1850-1900 (degrees C)
Data source: Byers et al (2022) AR6 Scenarios Database, hosted by the International Institute for Applied Systems Analysis (IIASA), doi:10.5281/zenodo.5886911. Median results and the classification of pathways into categories are based on MAGICC, with ranges based on MAGICC and FaIR, following IPCC AR6 WG3 methodology. Note that this can result in a divergence between the assessed uncertainty ranges and the pathway classification.
Limits warming to 1.5C in 2100 with a likelihood of greater than 50% with no or limited overshoot
1.5C no/limited overshoot
| Pathway category | C1 |
| GHG emissions change 2030 from 2019 (%) | -43 (-60 to -33.7) |
| Peak warming (C) | 1.57 (1.42 to 1.61) |
| 2100 warming (C) | 1.33 (1.11 to 1.46) |
| Overshoot duration (years) | 28 (0 to 56) |
| Likelihood of peak warming staying below 1.5C (%) | 38 (33.8 to 58.1) |
Global GHG emissions (Gt of CO2-equivalent)
Data source: Byers et al (2022) AR6 Scenarios Database, hosted by the International Institute for Applied Systems Analysis (IIASA), doi:10.5281/zenodo.5886911. Median results and the classification of pathways into categories are based on MAGICC, with ranges based on MAGICC and FaIR, following IPCC AR6 WG3 methodology. Note that this can result in a divergence between the assessed uncertainty ranges and the pathway classification.
Using the interactive
Using the dropdown menu at the top of the interactive, users can choose between a range of possible futures for global GHG emissions and the temperature change they drive.
The dropdown includes 18 emissions pathways and pathway categories used in the latest IPCC report. Users can also select a time period out to 2050 or 2100.
The main chart in the interactive displays the projected changes in global temperatures under the selected pathway category (blue line). The plume indicates the range of central warming outcomes for different emission pathways in this category (blue shading).
The bars at the bottom of the main chart indicate the time period during which the best estimate of global warming under the highest (95%), median (50%) and lowest (5%) pathways in that category exceeds the 1.5C threshold. This is shown as a red bar for each category, unless 1.5C is not exceeded.
Note that this only shows the uncertainty across the different pathways in that category, not the uncertainty in the physical response of the climate system. If this physical uncertainty were also considered, both higher and lower warming outcomes would be possible.
The secondary chart shows the global GHG emissions under the selected pathway (blue line) as well as the uncertainty range (blue shading). Emissions are in gigatonnes of CO2-equivalent, based on the average warming potential of gases over 100 years (GWP100), taken from the Working Group I (WG1) part of the IPCC’s sixth assessment report (AR6).
The box to the right of the main chart sets out the key figures for the pathway, including the required reduction in GHGs by 2030 compared to 2019, its peak and end-of century warming, the likelihood of peak warming staying below 1.5C and the duration of any temperature overshoot. Both the median and the uncertainty range are given.
Pathway choices
The pathways included in the interactive were assessed by the IPCC AR6 Working Group III (WG3) report. They draw on a database of more than 3,000 different futures for global emissions. These were developed by researchers around the world and submitted to the database in response to an open call. They then underwent a selection process carried out by authors of the AR6 report.
The pathways are primarily generated by integrated assessment models (IAMs), which examine energy technologies, energy use choices, land-use changes and societal trends that cause – or prevent – GHG emissions. These IAMs are simplified representations of complex physical and social systems, focusing on how economies, society and the environment interact.
In the WG3 report, scenarios are broadly divided into eight different “climate categories”, labelled C1 through to C8, according to their 21st century warming (see table below). These assignments are a product of climate model emulators such as MAGICC and FaIR, as the IAMs do not calculate temperatures themselves.
These pathways all have their own features – for example, how likely they are to hold temperatures to 1.5C or 2C, when greenhouse gas emissions are likely to peak and when they will reach net-zero.
To meet the terms of the Paris Agreement, pathways should achieve three main criteria informed by different articles of the agreement:
- Pursuing efforts to limit warming to 1.5C (Article 2.1a).
- Limiting warming to well below 2C (Article 2.1a).
- Achieving net-zero greenhouse gas emissions in the second half of the 21st century (Article 4.1).
The most ambitious pathways are categorised as “C1”. These pathways have a 50% or higher chance of limiting warming to 1.5C, with no or limited overshoot, plus around a 90% chance of limiting warming to 2C. Here, “limited overshoot” means exceeding 1.5C by up to 0.1C for no more than several decades in the central estimate.
The C1 pathways meet the Paris Agreement goals on limiting temperature rise.
There is also a “C1a” subcategory within C1 in which emissions of greenhouse gases also reach net-zero in the early 2070s, balancing sources and sinks in the second half of this century.
The C1a pathways show how the Paris Agreement goals can be fully achieved in terms of both limiting global warming and reaching net-zero greenhouse gas emissions. As well as meeting the criteria mentioned above, these pathways also see global GHG emissions peak before 2025 and roughly halve by 2030. This can be clearly seen when selecting “C1a” in the interactive.
The interactive also includes a sub-selection of scenarios in the C1 category which have a good chance of not overshooting 1.5C (“C1noOS”). In this group, which is not an official IPCC sub-category, not all of the scenarios reach net-zero GHGs, so it does not meet the three criteria of the Paris Agreement. The interactive shows only a range for this selection due to the limited number of scenarios in this sub-category.
Beyond the C1 category are pathways that only limit warming to 2C and not 1.5C and then those in which warming continues beyond 2C, 3C and even 4C. Except for C1a, none of these pathways can be considered fully compatible with the Paris Agreement.
In terms of the energy system, the global use of coal, oil and gas by 2050 in C1 pathways declines with median values of around 95%, 60% and 45%, respectively, compared to 2019. The use of coal, oil and gas without the deployment of carbon capture and storage (CCS) is reduced further, with median reductions of about 100% (that is, a complete phase-out), 60% and 70% in 2050, respectively, compared to 2019.
| Category | Name | Description |
|---|---|---|
| C1 | 1.5C no/limited overshoot | Limits warming to 1.5C in 2100 with a likelihood of greater than 50% with no or limited overshoot * |
| C1a | 1.5C no/limited overshoot, net-zero GHGs | Limits warming to 1.5C in 2100 with a likelihood of greater than 50% with no or limited overshoot *, while also reaching net-zero GHGs |
| C1b | 1.5C no/limited overshoot, no net-zero GHGs | Limits warming to 1.5C in 2100 with a likelihood of greater than 50% with no or limited overshoot *, without reaching net-zero GHGs |
| C1noOS *** | 1.5C no overshoot | Limits warming to 1.5C throughout the 21st century with a likelihood of at least 50% |
| C2 | 1.5C high overshoot | Returns warming after a high overshoot ** to 1.5C in 2100 with a likelihood of greater than 50% |
| C3 | Likely below 2C | Limits peak warming to 2C throughout the 21st century with a likelihood of greater than 67%. |
| C3a | Likely below 2C, action starting in 2020 | Limits peak warming to 2C throughout the 21st century with a likelihood of greater than 67%, with action starting in 2020 |
| C3b | Likely below 2C, NDCs, delayed action | Follows the trajectory of Nationally Determined Contributions (NDCs), as of the end of 2021, until 2030 with rapid acceleration of mitigation efforts after 2030 to limit warming to 2C with a likelihood of greater than 67% |
| C4 | Below 2C | Limits peak warming to 2C throughout the 21st century with a likelihood of greater than 50%. |
| C5 | Below 2.5C | Limits peak warming to 2.5C throughout the 21st century with a likelihood of greater than 50%. |
| C6 | Below 3C | Limits peak warming to 3C throughout the 21st century with a likelihood of greater than 50%. |
| C7 | Below 4C | Limits warming to 4C throughout the 21st century with a likelihood of greater than 50%. CO2 and GHG emissions do not reach net-zero and temperature does not peak in this century. |
| C8 | Above 4C | Exceeds warming of 4C during the 21st century with a likelihood of greater than 50%. |
* Limited overshoot refers to temporarily exceeding 1.5C global warming by up to about 0.1C for up to several decades.
** High overshoot refers to temporarily exceeding 1.5C global warming by 0.1-0.3C for up to several decades.
*** This is a sub-selection of scenarios in the C1 category that have a 50% or greater probability of limiting peak warming to 1.5C. It is not an IPCC sub-category.
The WG3 report also included seven “illustrative pathways”, which highlight how different mitigation choices across major economic sectors translate into future emissions and temperatures (see table below). These only have a central estimate in the interactive because each of these pathways is just a single scenario.
Five of those illustrate key mitigation themes that feature throughout the WG3 report (known as “illustrative mitigation pathways” or IMPs). Two further pathways illustrating high emissions resulting from the continuation of current policies (“CurPol”) or moderately increased action (“ModAct”) were also selected. Together, these pathways help to explain how human choices will shape future climate change.
The temperature changes associated with the pathways fall within the breadth of the climate categories.
| Name | Description | Matching category |
|---|---|---|
| Shifting pathways (IMP-SP) | Illustrates mitigation in the context of a broader shift towards sustainable development, including by reducing inequality, and with a phase-out of fossil fuels. | C1a |
| Low demand (IMP-LD) | Illustrates a strong emphasis on energy-demand reductions, and with a phase-out of fossil fuels. | C1a |
| Renewables (IMP-Ren) | Illustrates a future with a heavy reliance on renewable energy. | C1b |
| Extensive use of net negative emissions (IMP-Neg) | Illustrates a future with deployment of carbon dioxide removal that results in net negative global GHG emissions. | C2 |
| Gradual strengthening of current policies (IMP-GS) | Illustrates a gradual strengthening of climate policies implemented in 2020, with rapid reductions mid-century and a massive reliance on net negative emissions by the end of this century. | C3b |
| Moderate action (ModAct) | Illustrates a future in which, by 2030, countries meet the Nationally Determined Contributions (NDCs) they set out in 2020, but only moderate further action is taken. | C6 |
| Current policies (CurPol) | Illustrates a future with relatively high emissions, highlighting what happens to future emissions and temperatures if we follow policies implemented in 2020. | C7 |
The IPCC figure below illustrates the future changes in the energy system under the seven illustrative pathways through this century. It shows total energy supply (black line) and the split between renewables (blue shading), biomass (pale blues), fossil fuels (red) and nuclear (orange).
In the three most ambitious illustrative pathways (IMP-SP, IMP-LD and IMP-Ren) – which match the C1 category of limiting warming to 1.5C with a likelihood of more than 50% with no or limited overshoot – the contribution of fossil fuels declines steadily and decisively through the entire century. As the IPCC states, the energy supply in all three shows a de-facto “phase-out of fossil fuels”.
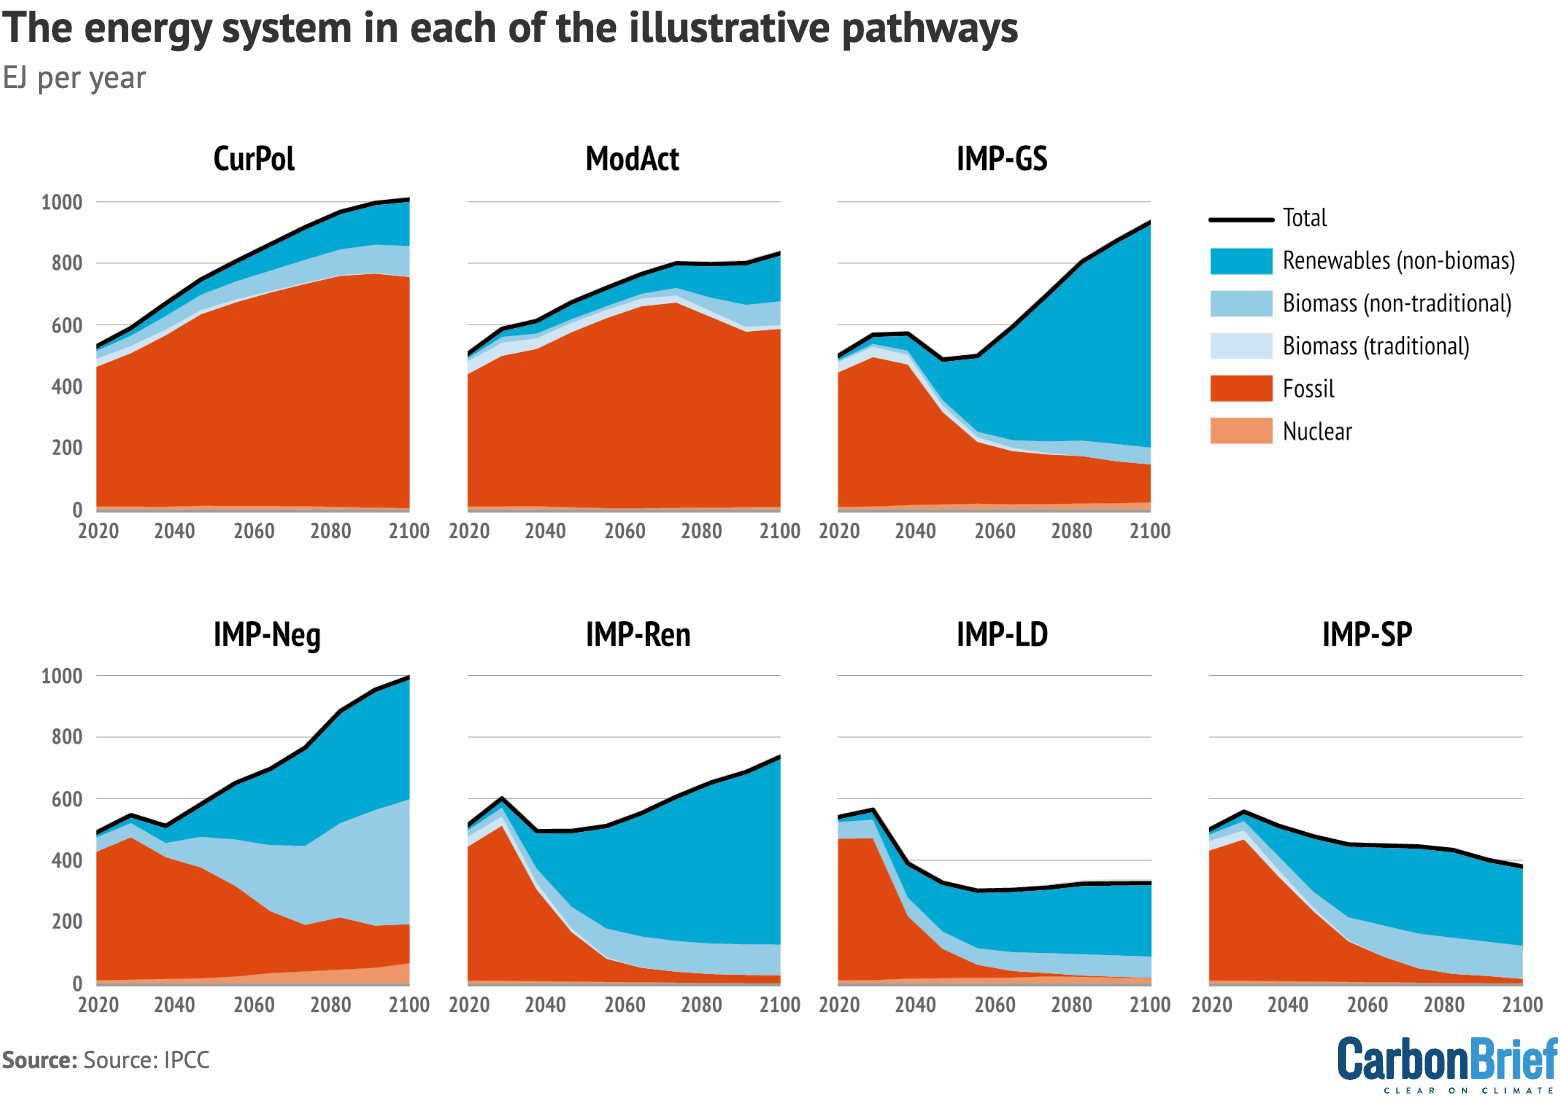
The energy system in each of the illustrative pathways out to 2100. It shows total energy supply (black line) and the split between renewables (blue shading), non-traditional biomass (mid-blue), traditional biomass (pale blue), fossil fuels (red) and nuclear (orange). Source: IPCC (2022) Figure 3.8.
The 1.5C limit
While the Paris Agreement triggered a huge amount of attention – politically and scientifically – on limiting warming to 1.5C, global temperatures have continued to rise.
The decade of 2013-22 was, on average, around 1.15C warmer than pre-industrial levels. As human activities continue to impact the climate, global temperatures are now rising at the record rate of around 0.2C every 10 years. Moreover, they will keep rising until CO2 emissions reach net-zero.
With the world currently not on track to limit global warming to 1.5C, the executive secretary of UN Framework Convention on Climate Change (UNFCCC) Simon Stiell has called for a “turning point” at COP28, with strengthened national commitments and actions that are fully aligned with limiting warming to 1.5C.
However, the more that warming creeps towards this threshold, the more scope there is for misinterpreting what the Paris Agreement’s 1.5C aspirational limit actually means.
This is especially true as the world nears its first individual year that is 1.5C warmer than pre-industrial levels. Indeed, there is a chance that this could happen in 2023.
A crucial distinction is that the 1.5C limit in the Paris Agreement refers to long-term warming – the IPCC uses 20 to 30 years – not annual temperatures that include the short-term influence of natural fluctuations in the climate, such as El Niño.
(In a recent comment article in Nature, scientists at the UK Met Office have suggested a way of estimating the current level of global warming by blending observations for the past 10 years with climate model projections or forecasts for the next 10 years. Similar proposals have been made by other research and the IPCC’s special report on 1.5C.)
The scenarios reflected in this interactive allow for the exploration of pathways towards such long-term goals.
So if temperatures temporarily rise above 1.5C for a single year, or in a single place, it highlights that the world is going in the wrong direction, but not that the Paris Agreement is lost.
And even if temperatures were to exceed 1.5C over a longer period, during an overshoot, the Paris Agreement’s ambitions can still be met by bringing them back down. However, every fraction of a degree matters – the higher and longer the overshoot, the more severe the climate impacts and risks, and their legacy.
Breaching 1.5C
The uncertainties around how quickly the world will cut emissions and how global temperatures will respond to rising greenhouse gas emissions make it difficult to pinpoint exactly when the world might reach or exceed the 1.5C limit.
In its AR6 WG1 report, the IPCC concluded that in all but the highest emission scenario, “the central estimate of crossing the 1.5C threshold lies in the early 2030s”. However, the full range of the results spanned from the early 2020s to much later in the century, depending on the emissions scenario.
As the interactive shows, even under the Paris-compatible C1a scenarios, warming in the central estimate would cross 1.5C in the near term, before temperatures decline back below 1.5C.
However, it is important to highlight that when considering physical climate uncertainty, a 33% chance remains that peak warming will never exceed 1.5C. In other words, it is not likely – in the IPCC’s calibrated language – that global warming of 1.5C will be exceeded in C1 pathways – rather, these pathways would only be reaching 1.5C. Pathways from all other categories exceed 1.5C with a higher probability.
When it comes to the risks of climate change, the rate of global warming is also crucial. The pace at which temperatures will reach 1.5C depends on the emissions pathway. Under low emissions pathways (for example, C1) the rate of warming is also lower, indicating that warming is on its way to peaking. Under higher emissions scenarios, the rate of temperature change when 1.5C is breached is also much higher, indicating that the world is far from a solution to global warming.
However, there are key uncertainties around how global temperatures will be affected by rising atmospheric CO2 concentrations, the impacts of efforts to cut air pollution (which would otherwise have a cooling effect), and other processes such as carbon released from thawing permafrost.
Climate models can help scientists to understand how variations in these complex processes can lead to differences in future warming under the same emissions pathway, and also how they change the probability of temperatures staying below 1.5C.
Ultimately, it means that there are a range of possible temperature outcomes for any point in time under a given emissions pathway, as shown by the interactive.
However, none of this changes the fact that keeping the Paris Agreement’s 1.5C limit in reach requires reducing emissions strongly and reaching net-zero CO2 emissions around the middle of this century.
Near-term warming rates
While the potential timing for crossing the 1.5C limit is similar in a lot of pathways, research shows that cutting emissions in line with the Paris Agreement would have a clear impact on global temperatures within two decades.
The chart below shows decadal warming rates up to 2050 under five of the illustrative pathways, which were used in the latest WG3 report to show different development pathways. These pathways, which are also reflected in the interactive, are: sustainable development (SD), low energy demand (LD), renewable energy (Ren), gradual strengthening (GS) and moderate further action (ModAct). The shading indicates warming (red) or cooling (blue).
The figure highlights how strong mitigation – the three pathways on the left-hand side – could not only see the current rate of temperature rise of around 0.2C per decade halved by the 2030s, it could also halt or even reverse warming by mid-century.
In contrast, delaying rapid emissions reductions until mid-century – such as in the GS pathway – would mean that warming only starts to noticeably slow down in the 2040s. And if countries do not raise ambition, but continue to follow their initial pledges under the Paris Agreement with only moderate further action (the ModAct pathway), warming would essentially continue at its current unprecedented rate.
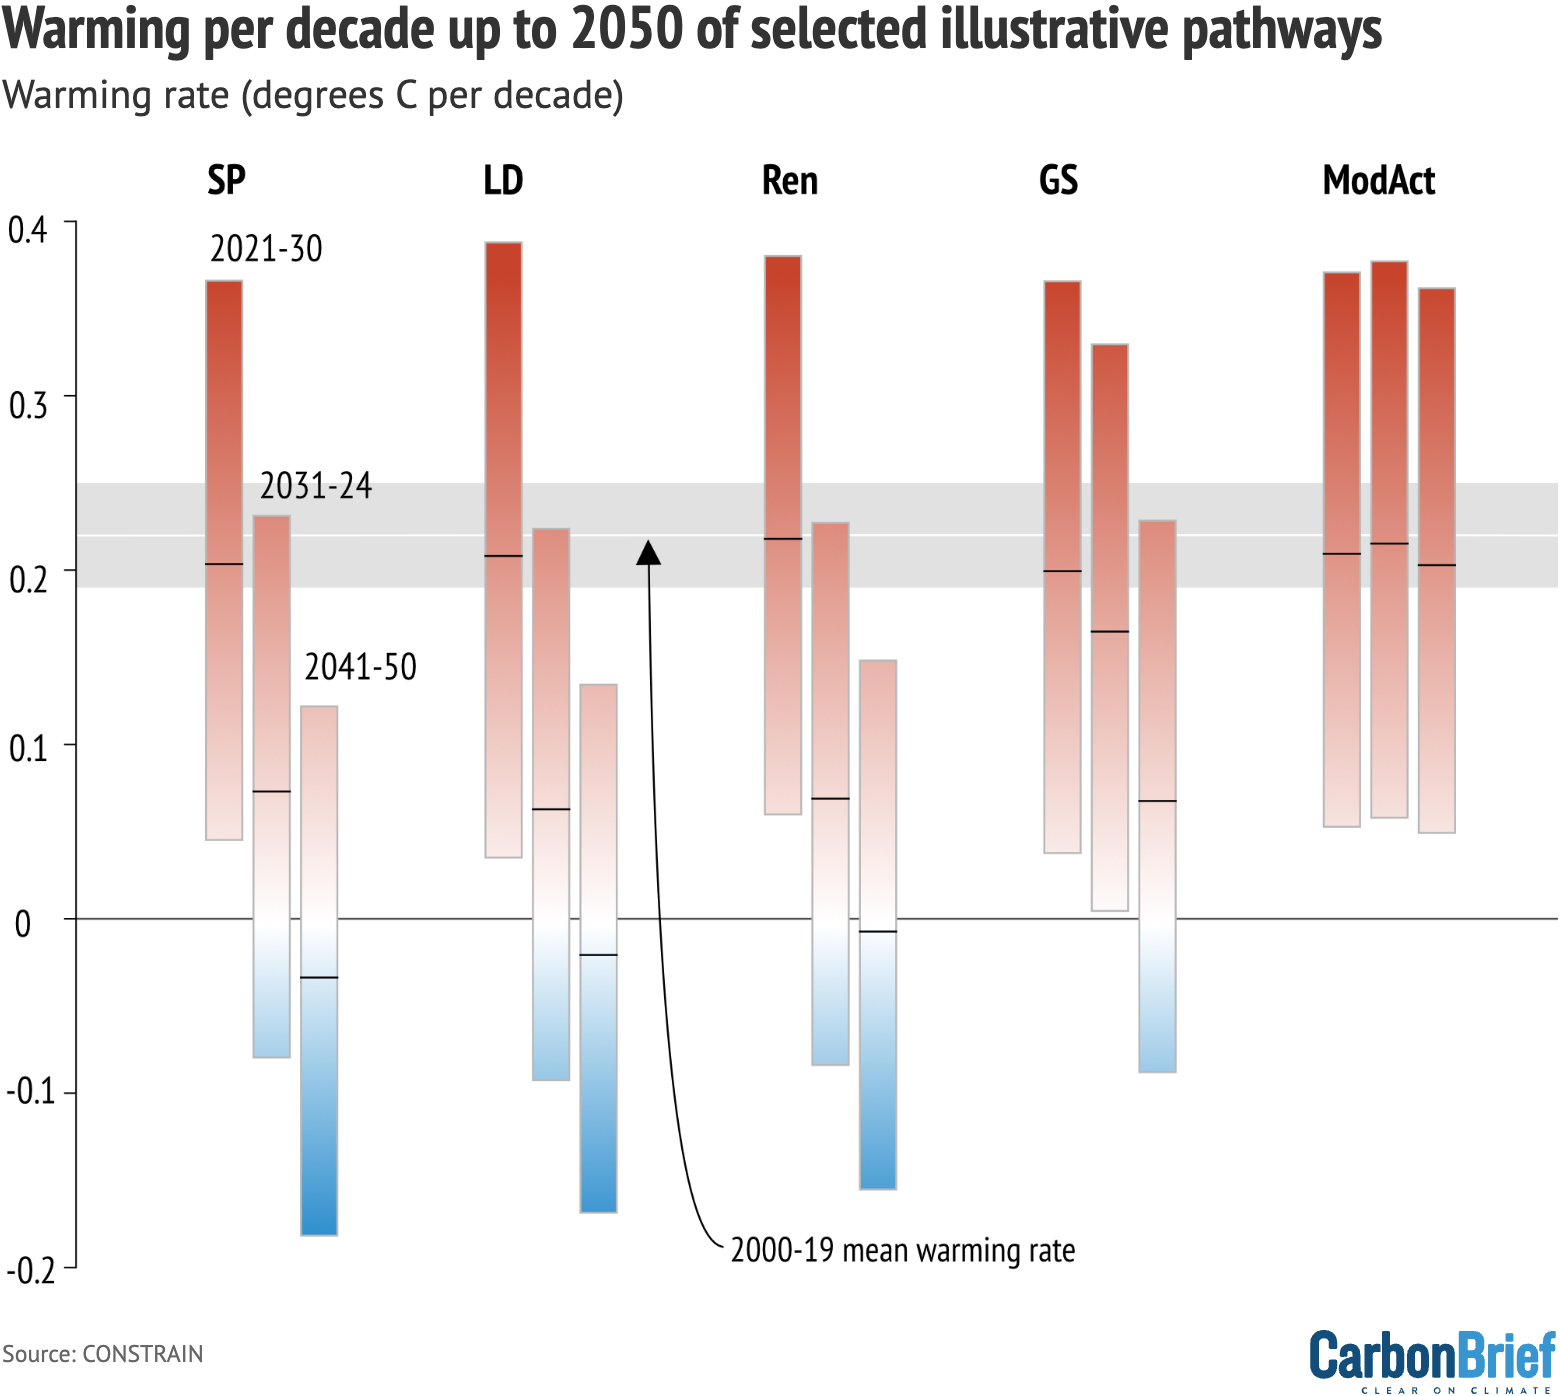
Warming per decade up to 2050 of selected illustrative pathways: shifting pathways, SP (matching category: C1a), low energy demand, LD (C1a), renewable energy, Ren (C1b), gradual strengthening of current policies, GS (C3b) and the reference pathway for moderate action, ModAct (C6), based on projections from FaIR. Credit: CONSTRAIN (2022)
These relatively small differences in warming rates will have significant implications for climate impacts in the coming decades.
Every increment of global warming increases future climate impacts and loss and damage.
This means that differences in warming between scenarios, even if only by fractions of a degree, have significant implications. This is especially true at the regional scale with some countries more strongly affected, or less able to respond, than others.
For example, warming of 1.7C rather than 1.5C by 2050 could increase the number of people exposed to heatwaves by around one third in a number of different countries across the world. Warming of 1.8C in 2050 increases these numbers by a further 10% or more.
Slowing down warming could not only give more time and space to adapt to climate impacts, it could also deliver multiple benefits for society, such as limiting biodiversity loss, supporting ecosystem services, health and livelihoods, and slowing sea level rise. There would also be economic benefits from the reduced costs of adaptation and avoided damages.