Can switching to vegetarian, vegan or other diets help to reduce emissions?
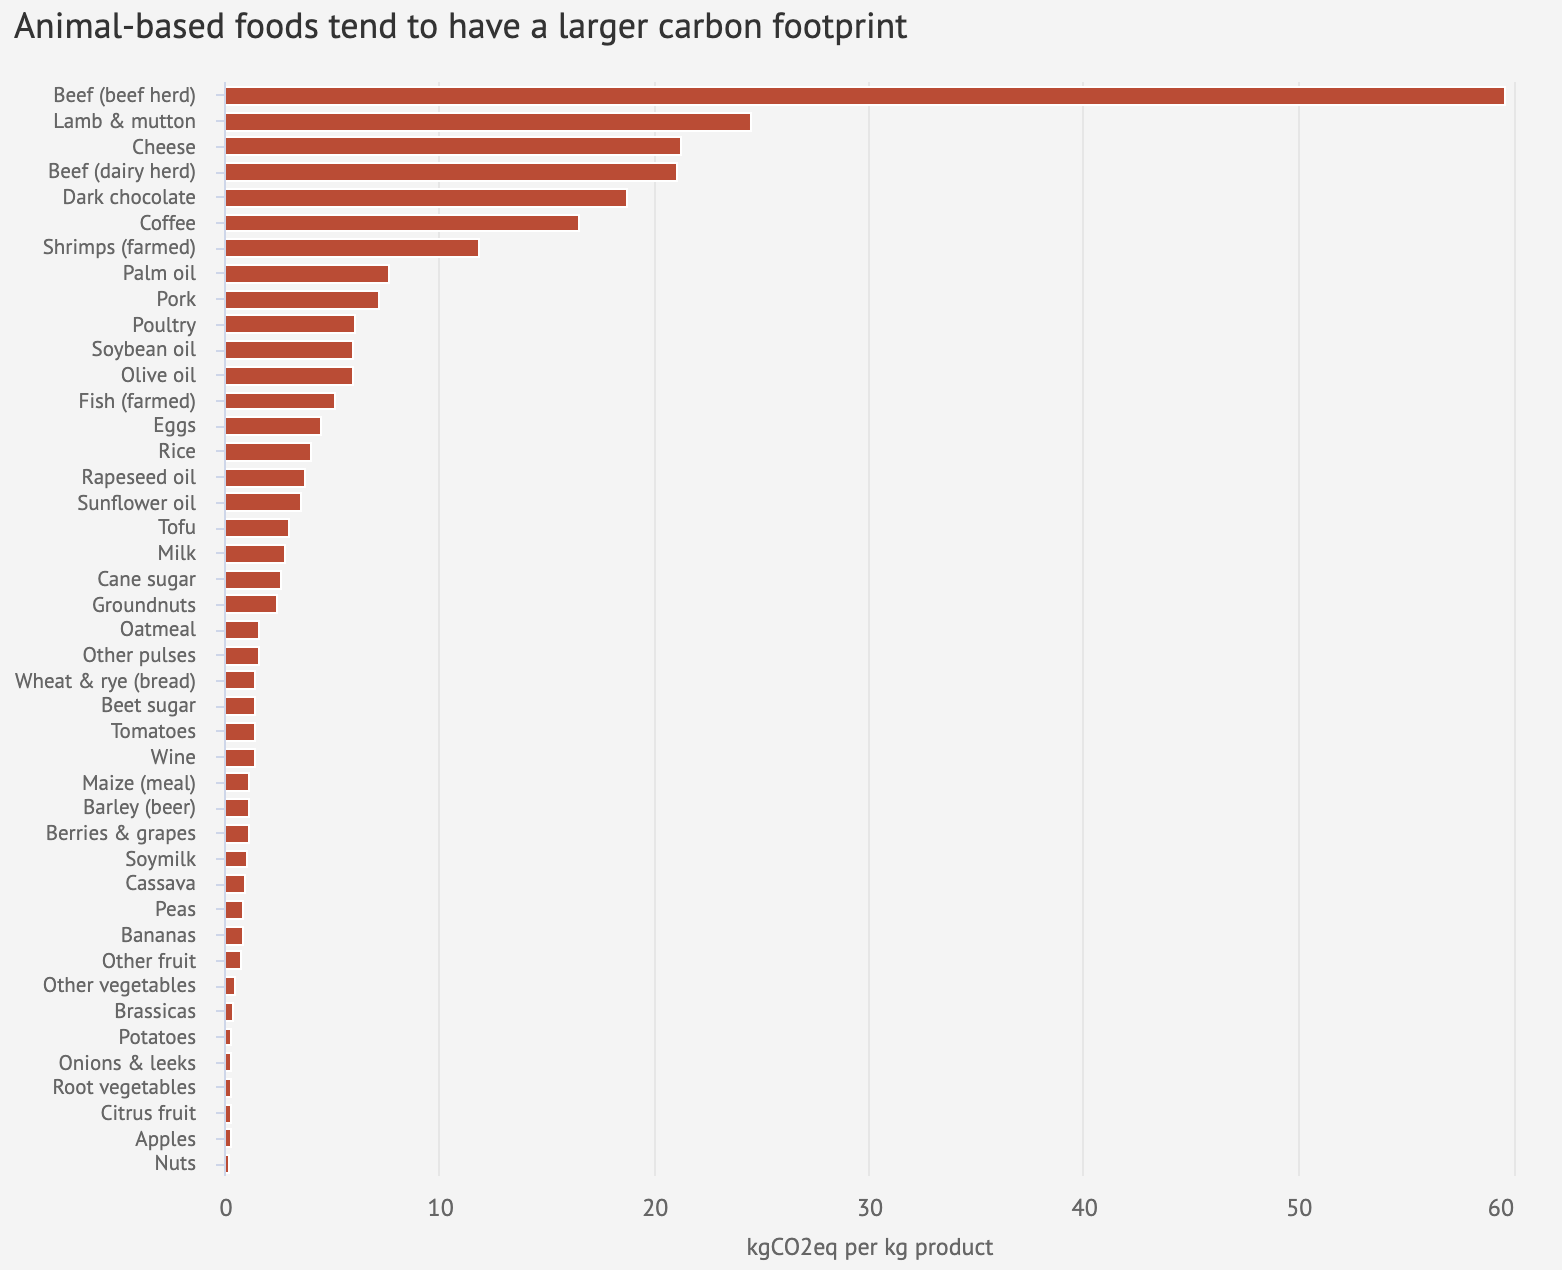
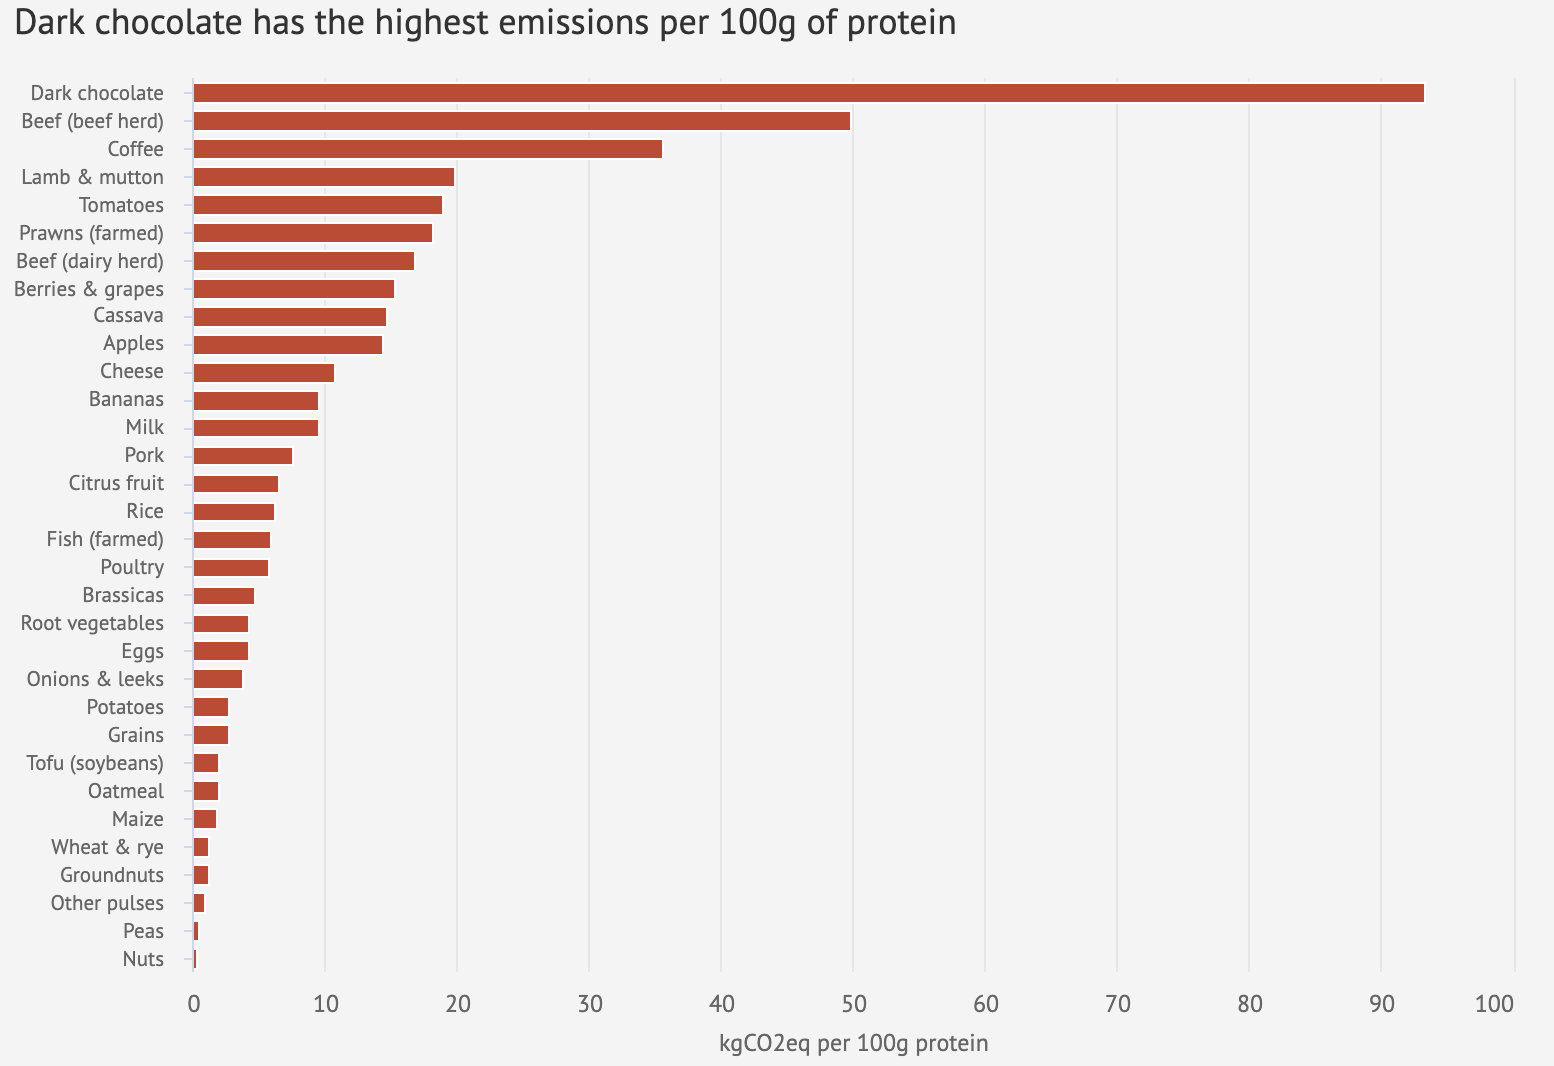
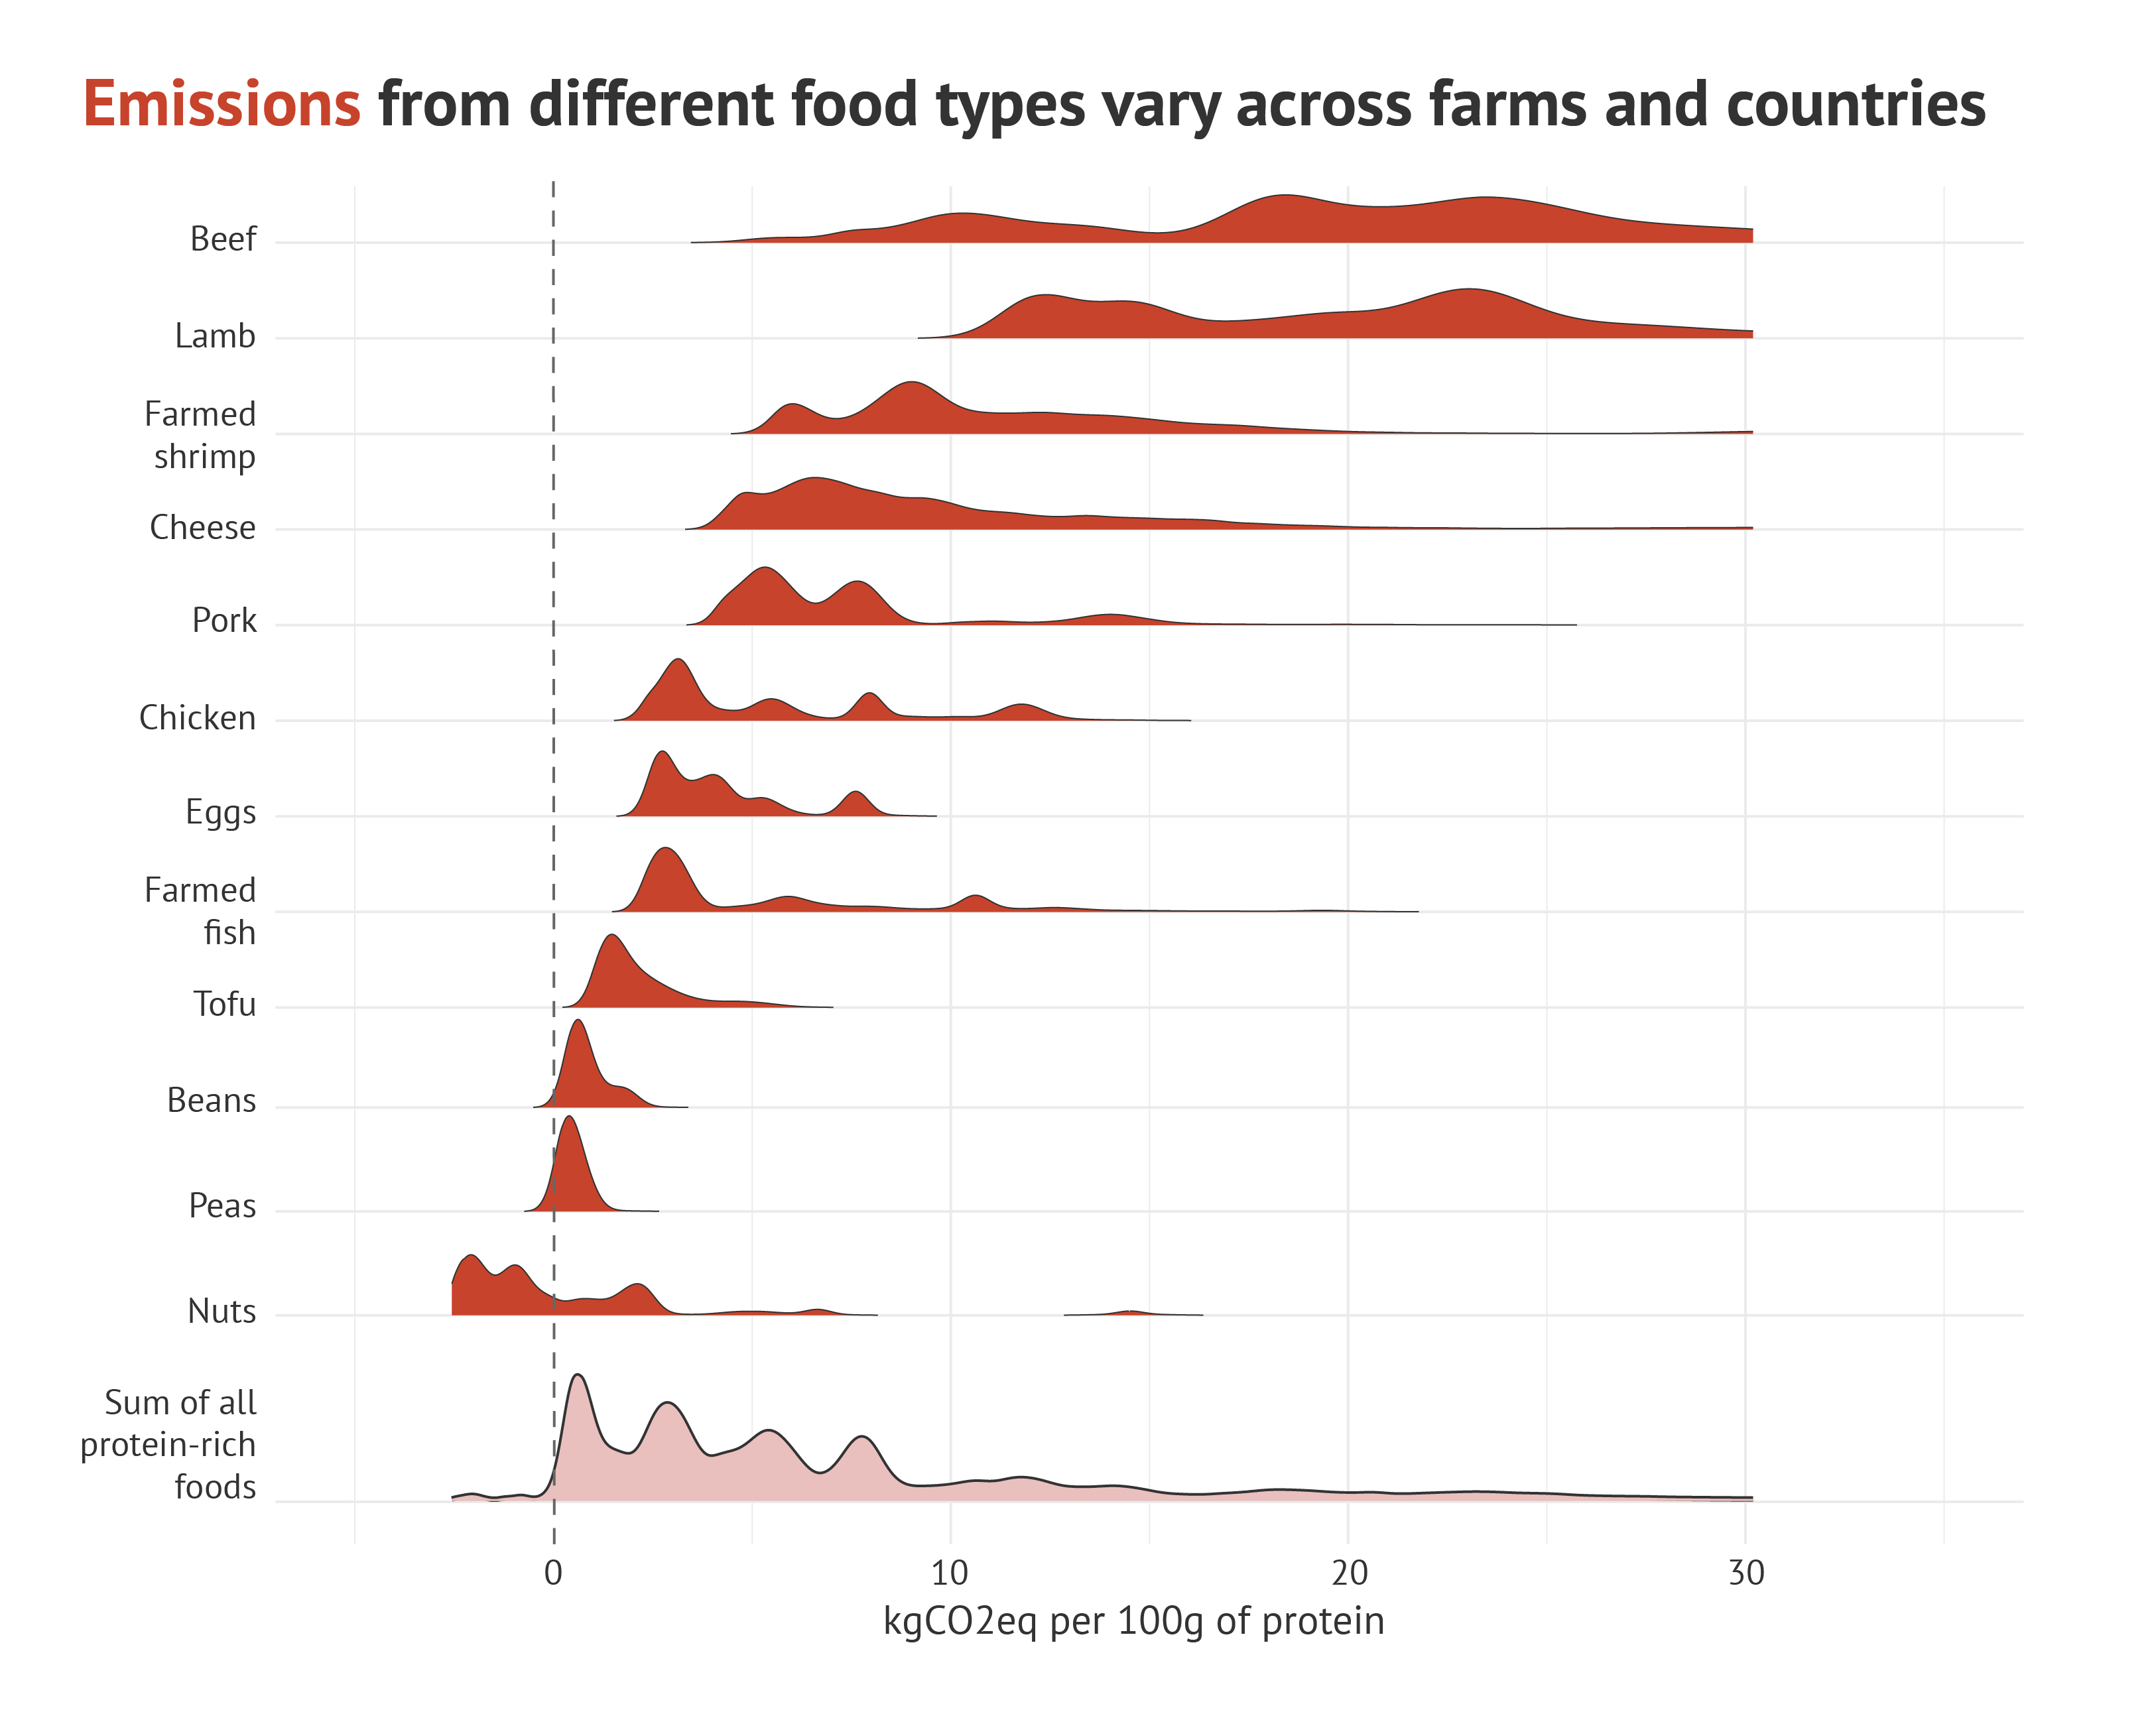
Given that the climate impact of plant-based foods is typically 10 to 50 times smaller than that of animal products, it follows that switching from a largely meat-based diet to a vegetarian or vegan diet could help to reduce emissions.
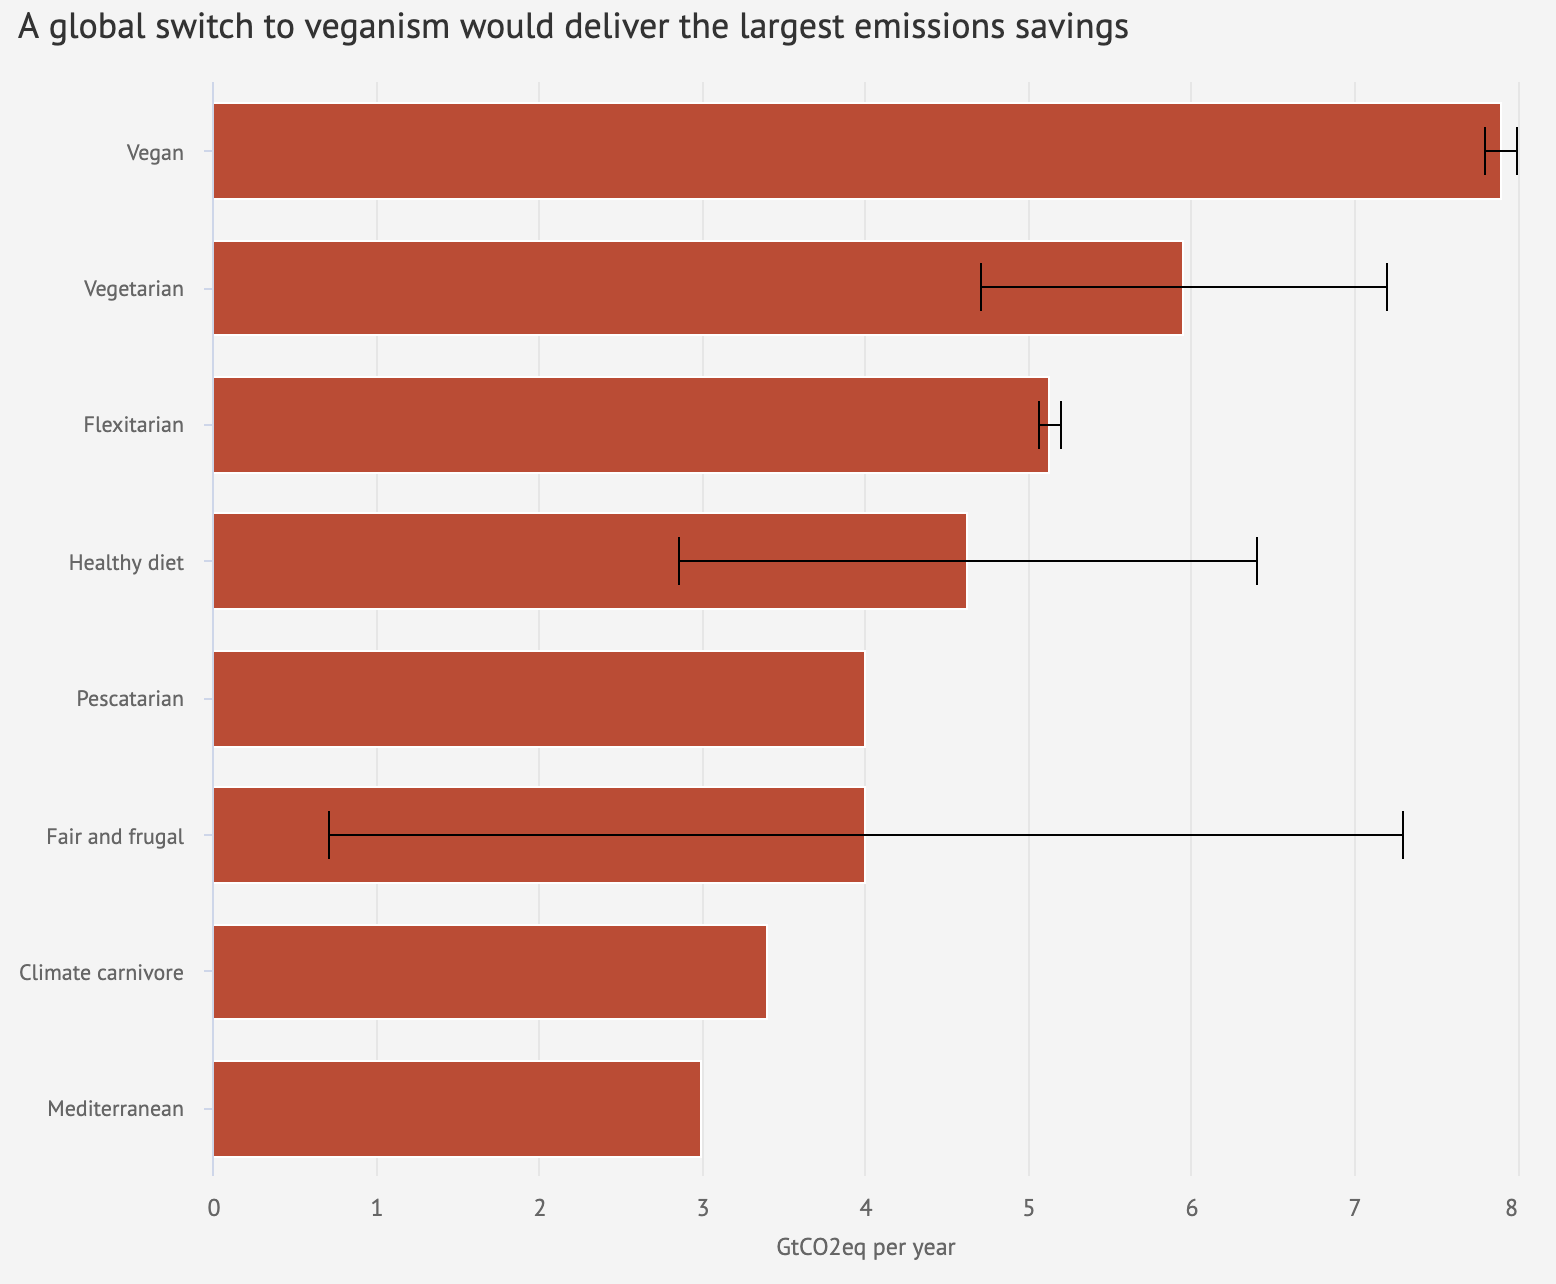
The chart below shows how much greenhouse gases could be stemmed if the world were to adopt various different diets.
Greenhouse gas savings potential from the global adoption of various diets. Error bars show the spread of results from different studies. Data without error bars are from one study only. Adapted from IPCC (2018). Chart by Carbon Brief using Highcharts.
The analysis comes from a report by the Intergovernmental Panel on Climate Change (IPCC), an independent research group made up of the world’s leading climate scientists. The report defines the different diets referenced in the chart above as follows:
- Vegan: a completely plant-based diet.
- Vegetarian: a diet of grains, vegetables, fruits, sugars, oils, eggs and dairy and around one serving of meat or seafood per month.
- Flexitarian: a diet in which 75% of meat and dairy is replaced by cereals and pulses. (This includes at least 500g of fruit and vegetables and at least 100g of plant-based protein per day – and no more than one portion of red meat a week.)
- Healthy diet: a diet based on global dietary guidelines, which involves eating less meat and more fruit and vegetables.
- Fair and frugal: a diet assuming food is shared equally across the world with each person consuming 2800 calories a day. (This involves a relatively low level of animal products.)
- Pescetarian: a vegetarian diet that includes seafood.
- Climate carnivore: a diet where 75% of red meat is replaced with other meat.
- Mediterranean: a diet of vegetables, fruits, grains, sugars, oils, eggs, dairy, seafood and moderate amounts of poultry, pork, lamb and beef.
In the IPCC’s special report on climate change and land, the team of scientists analysed recently published scientific papers that look into how these different diets could help to stem greenhouse emissions.
The chart above displays the total amount of greenhouse gases that could be saved each year by 2050 if the world were to adopt each of these diets, when compared to a “business-as-usual” scenario for 2050. (The “business-as-usual” scenario is based on projections of continued population growth and rising meat intake from the FAO.)
(The chart shows the savings in terms of millions of tonnes of CO2 equivalent [CO2e] – a measure used to compare the emissions from various greenhouse gases.)
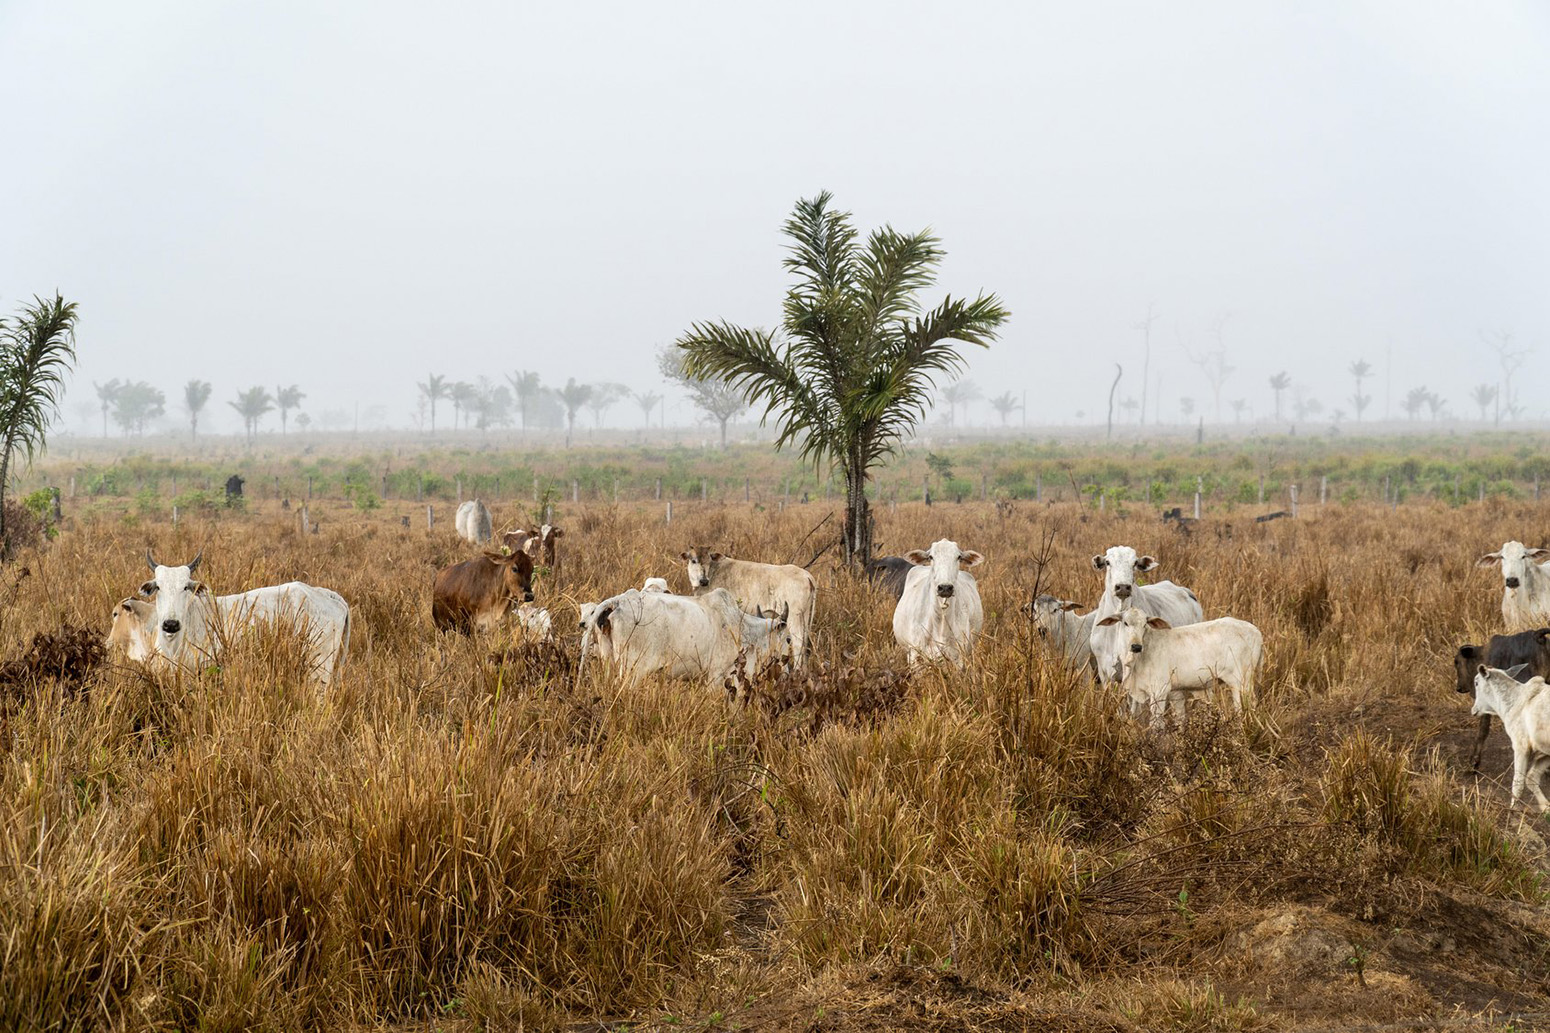
Savings come both from ridding the world of the greenhouse emissions associated with livestock production (see: How do emissions from meat, dairy and other foods compare?) and also from sparing land that would otherwise be needed for livestock rearing.
The analysis shows that a global switch to veganism would deliver the largest emissions savings out of any dietary shift.
According to the analysis, a switch to veganism could save almost 8bn tonnes of CO2e a year by 2050, when compared to a “business-as-usual” scenario. (By comparison, all food production currently causes around 13.7bn tonnes of CO2e a year.)
The steep reduction in emissions would partially stem from the freeing up of large amounts of land, which could be used to plant forests capable of removing CO2 from the atmosphere, the IPCC authors say:
“Under the most extreme scenario where no animal products are consumed at all, adequate food production in 2050 could be achieved on less land than is currently used, allowing considerable forest regeneration, and reducing land-based greenhouse gas emissions to one third of the reference ‘business-as-usual’ case for 2050.”
(Separate research finds that the emissions savings from a global switch to veganism could actually be as high as 14.7bn tonnes of CO2e a year.)
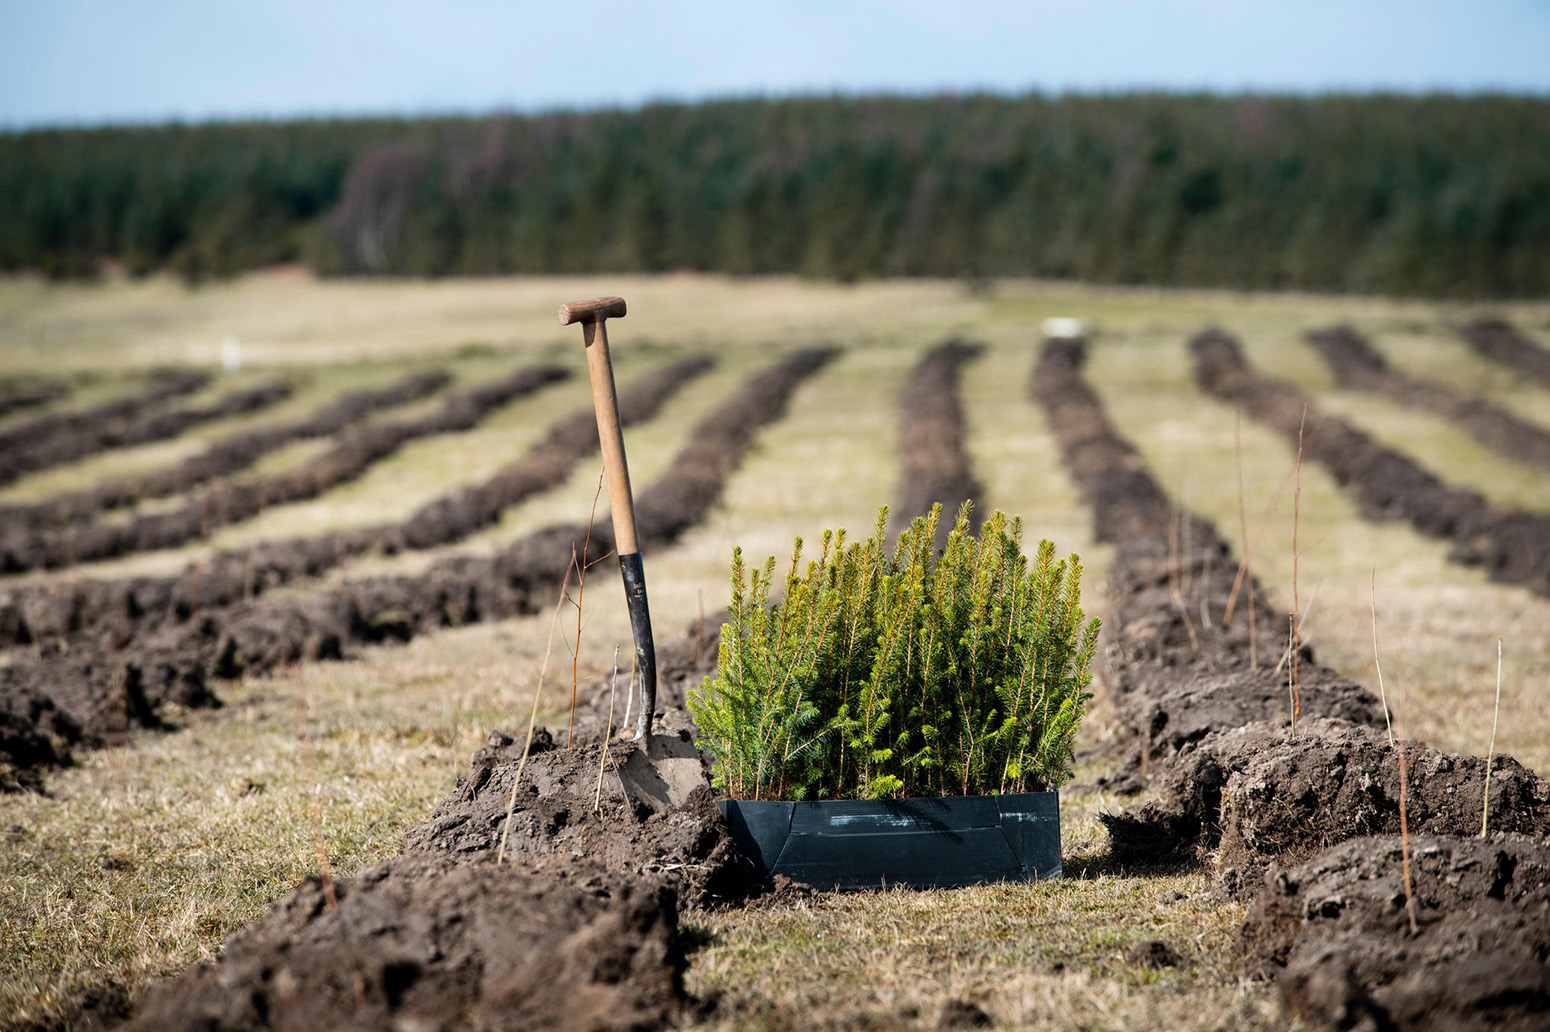
The first trees being planted in England's largest forest for more than 30 years at Doddington North Moor. Credit: Andrew O'Brien / Alamy Stock Photo.
The second highest emissions savings would be delivered by a global shift to vegetarianism which, in the analysis, still includes around one serving of meat or fish a month. An adoption of this diet could save 6bn tonnes of CO2e a year by 2050, according to the analysis.
Following this is a shift to “flexitarianism” – a diet where three-quarters of meat and dairy is replaced by plant-based alternatives. A global shift to this diet could save just over 5bn tonnes of CO2e a year by 2050, the analysis says.
It is worth noting that, while veganism offers large emissions savings when compared to a “business-as-usual” scenario, the additional benefits become smaller when compared to vegetarianism and flexitarianism, says Willett:
“What if everybody became a vegan? Compared to business as usual, it would reduce emissions a lot. But compared to a more flexitarian diet, the additional reduction is modest. And it might make feeding people harder in some regions because we’re taking off the table meat that was raised on land that can’t seem to be used for other types of food production.”
The analysis also shows that a global shift to “healthy” eating could offset around 4.5bn tonnes of CO2e a year by 2050.
In addition, the majority of national healthy eating guidelines recommend that their citizens eat less meat and more fruits and vegetables. (For example, Public Health England’s Eatwell Guide suggests the average Briton should eat less red and processed meat and consider choosing low-fat alternatives to dairy.)
A study published in 2016 found a global shift towards more plant-based diets that are in line with standard dietary guidelines could reduce global mortality by 6-10% by 2050 in addition to reducing emissions by 29-70%, when compared to a business-as-usual scenario.
Back to top