The most highly cited publications in Carbon Brief’s Cosmos database reveal the building blocks supporting so many elements of climate science.
Every year, thousands of new scientific documents are published, from studies and reports to books and assessments.
Carbon Brief’s Project Cosmos pulls together the “universe” of climate research, spanning 1.8m publications from almost a century of scientific endeavor.
Research publications are linked through citations – where one study references others, perhaps using their methods, confirming their results or even challenging their findings.
Some of the most influential publications are cited hundreds or even thousands of times, becoming cornerstones of their academic fields.
Carbon Brief has calculated a citation score for each individual publication by counting how many times it has been cited by other research in the Cosmos database.
Using these scores, Carbon Brief has created the Cosmos 500 ranking for the most highly cited climate publications.
(This ranking only counts references from within Carbon Brief’s Cosmos database. This is distinct from the citation count given by, for example, Google Scholar, which counts all the references a publication has ever received.)
The results reveal the publications that underpin vast swathes of climate research.
Rather than blockbuster findings or eye-opening conclusions, the top-ranked publications in the Cosmos 500 are typically those that have transformed their field through a new statistical method, programming language or crucial dataset.

The
top 20
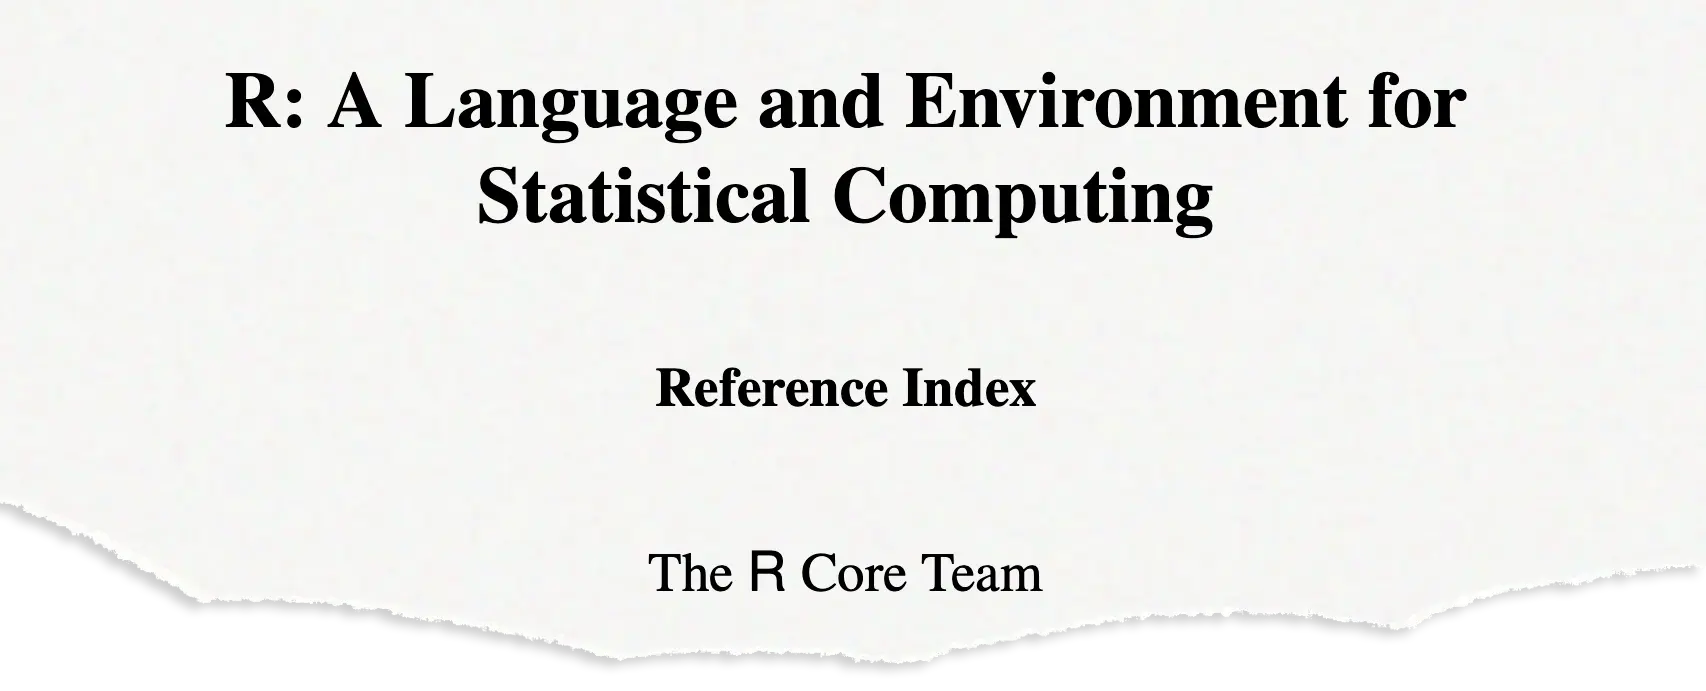
R: A language and environment for statistical computing (1993)
In first place, as the most highly cited in Carbon Brief’s Cosmos database, is not what would be considered a traditional research publication.
Rather than a book or study, it is a “reference index” for “R”, an open-source programming language used for statistical analysis and data visualisation.
So, instead of an introduction, methods section, results and conclusions, the document contains almost 4,000 pages of functions, packages and help files that R offers.
It is not the document itself that is significant – despite its score of 24,696. It is highly cited because R is so widely used around the world. And when it is mentioned in a publication, the reference index is typically cited.
R was initially developed in the early 1990s by two researchers working in the statistics department of the University of Auckland – Dr Robert Gentleman and Dr Ross Ihaka. Ihaka is now retired, while Gentleman is principal research scientist in the department of data science at the Dana-Farber Cancer Institute.
It is named “R” in a nod to both an earlier programming language called “S” and the initial letter of their first names.
The first public announcement of R was in 1993. In a 1995 study, Gentleman and Ihaka described their experience of designing and implementing a statistical computing language:
“Despite what has been a nearly all-consuming effort, we have managed to remain on the best of terms and retain our interest in computers and computing.”
R and its documentation is now maintained by the “R Core Team”.
As well as providing a wide range of statistical techniques, one of R’s main strengths is the “ease with which well-designed publication-quality plots can be produced”, the author team explains.
In a book on R, Prof Roger Peng – professor of statistics and data sciences at the University of Texas at Austin – points out that a “major advantage” that R has over many other statistical packages is “that it’s free”. He also notes its flexibility:
“Today, R runs on almost any standard computing platform and operating system. Its open-source nature means that anyone is free to adapt the software to whatever platform they choose. Indeed, R has been reported to be running on modern tablets, phones, PDAs [personal digital assistants] and game consoles.”
In 2025 alone, R was cited in a wide variety of climate-related studies, from producing a 17,000-year flooding dataset to using satellite data to monitor coral reefs, and from surveying the climate beliefs of US farmers to assessing urban heat in the world’s cities.
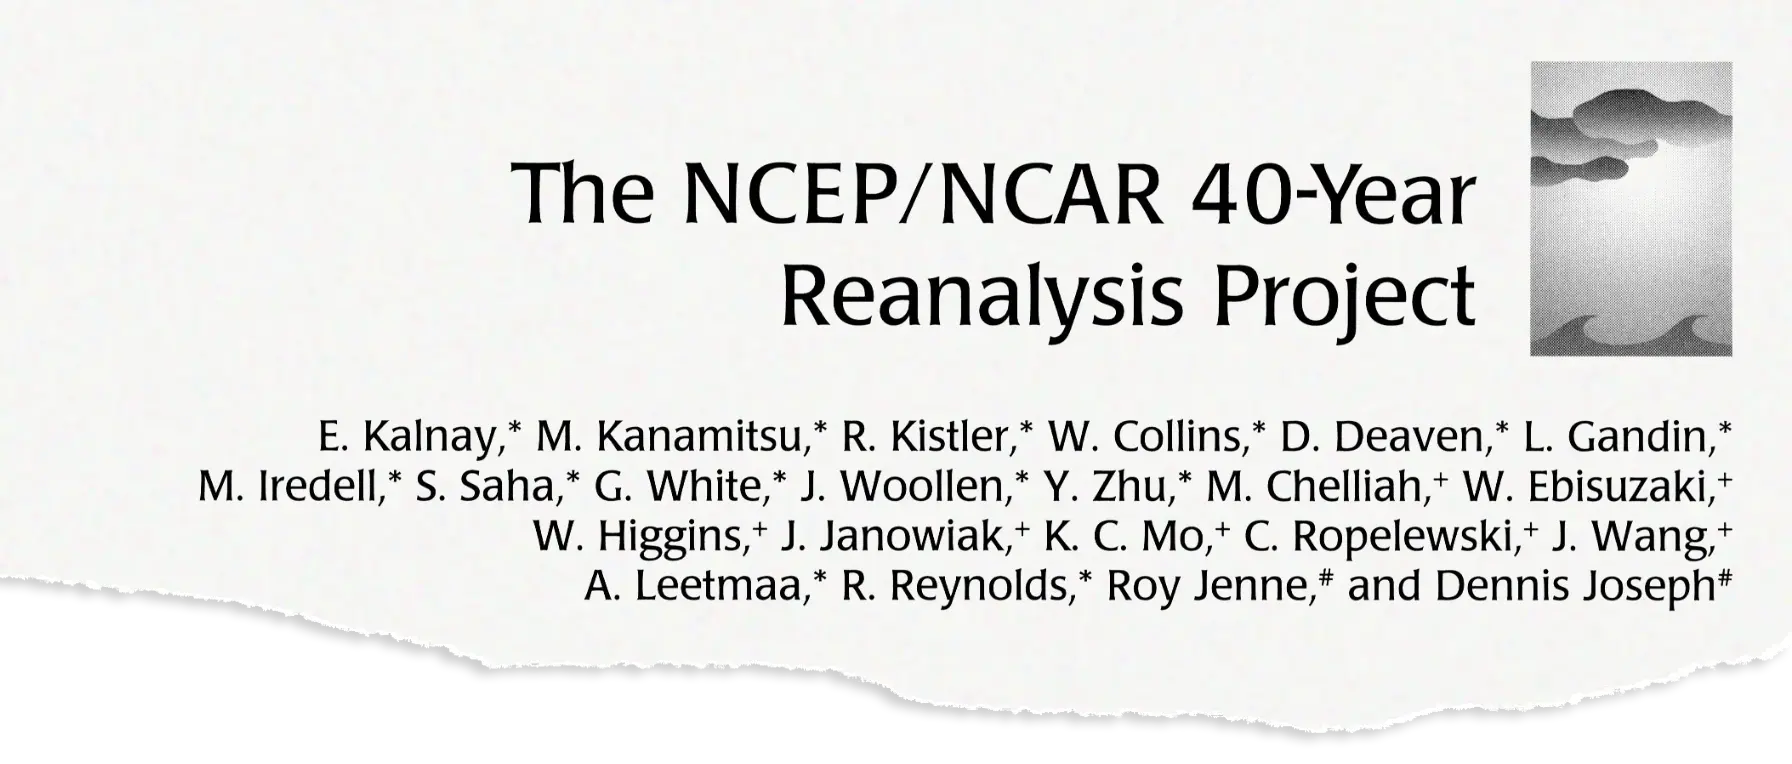
The NCEP/NCAR 40-year reanalysis project (1996)
In second place, with a Cosmos score of 19,049 is “The NCEP/NCAR 40-year reanalysis project”, published in the Bulletin of the American Meteorological Society in 1996.
This is one of three publications in the top 10 that introduce and describe a “reanalysis” climate dataset.
Reanalysis refers to a blended dataset, which combines traditional weather observations with model simulations to fill any gaps.
To produce a weather forecast, scientists use information on what the weather is like now – that is, observational data – and short-range forecasting models to simulate what will likely happen next.
Reanalysis works in a similar way, but the forecasting models are run in the past to reconstruct what has already happened – producing data even for time periods and parts of the world where observations are not available.
This process produces complete and consistent datasets, or “maps without gaps”.
The figure below, from the European Centre for Medium-Range Weather Forecasts (ECMWF), illustrates how reanalysis datasets are produced.
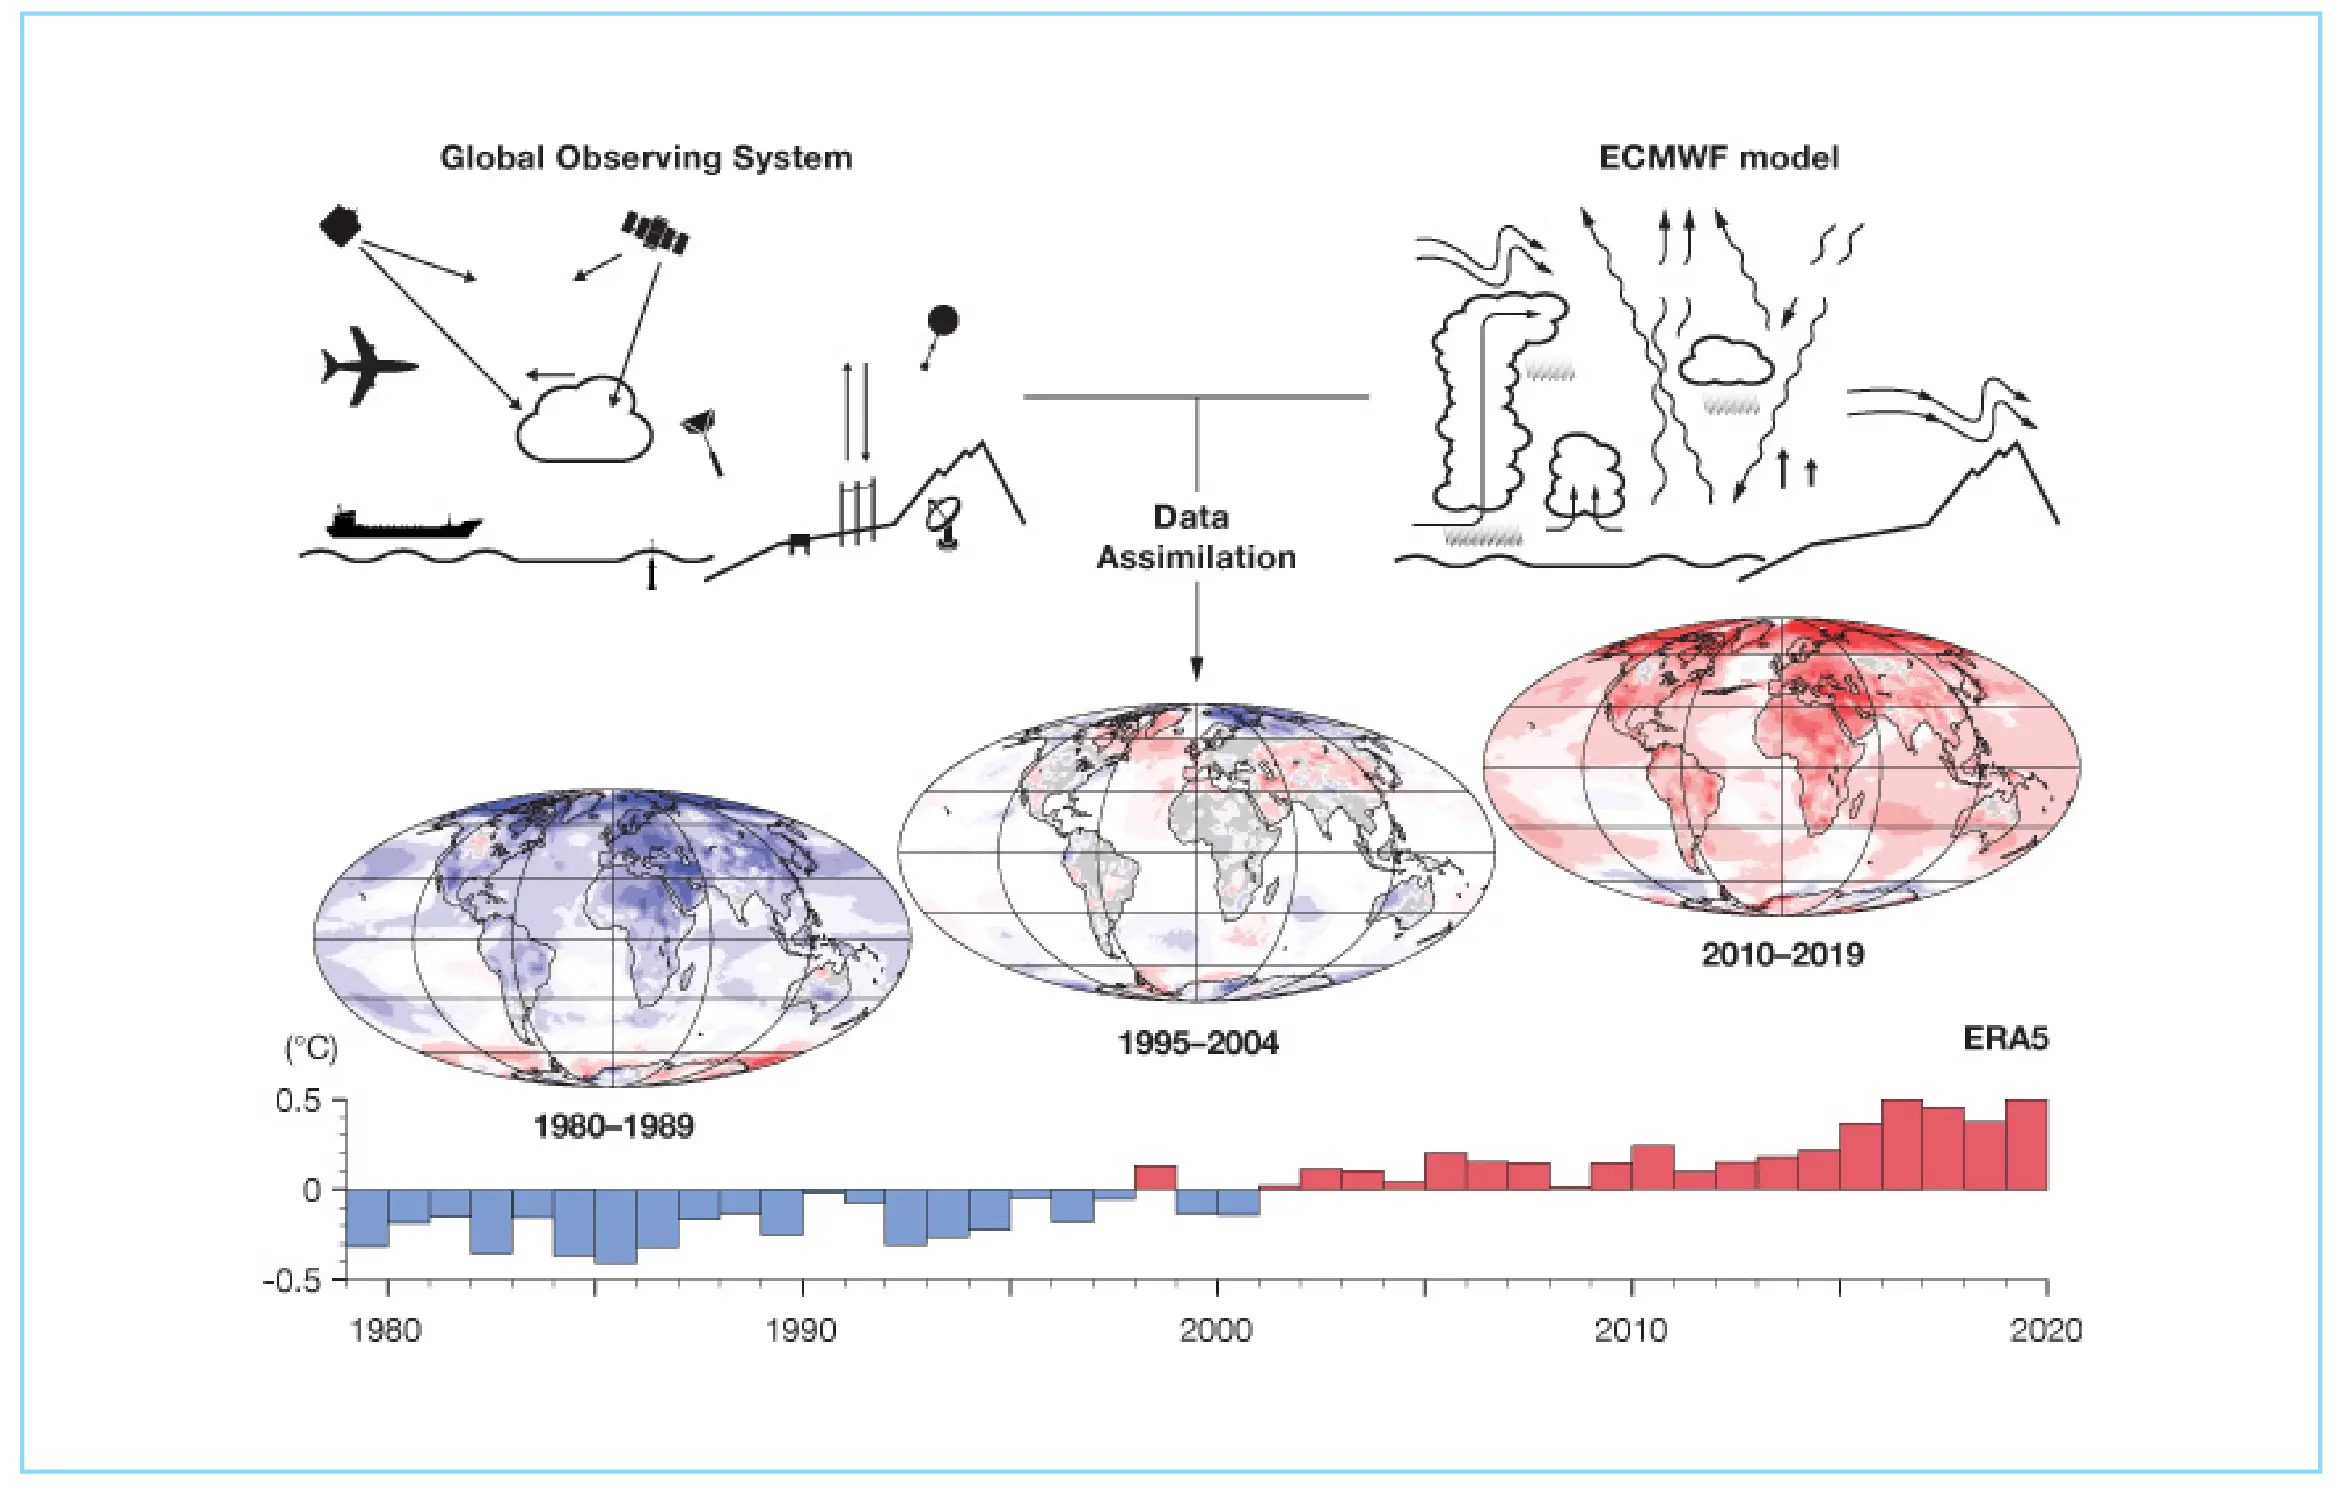
Reanalysis datasets have become hugely influential in climate research as they offer globally complete datasets that are “much easier to use than underlying observations”, which are often “scattered and in various data formats”, says Dr Hans Hersbach, reanalysis team leader at the Copernicus Climate Change Service (C3S).
Hersback tells Carbon Brief that reanalysis is an “integrator of information from any available observations” and can produce “the best-possible physically consistent global fields for a host of essential climate variables”.
The NCEP/NCAR project was a US collaboration between the National Centers for Environmental Prediction (NCEP) and National Center for Atmospheric Research (NCAR) to produce a global reanalysis of daily data for the 40-year period of 1957-96.
The work was led by Argentine meteorologist Prof Eugenia Kalnay, who died in 2024.
Prof Peter Thorne of Maynooth University in Ireland describes Kalnay as a “force of nature”, who made the NCEP/NCAR project happen “with a small dedicated team”.
The NCEP-NCAR project was among the first generation of comprehensive global reanalysis products. Thorne describes it as “truly groundbreaking science and the very birth of reanalyses”.
As it was the very early days of the internet, the data was initially made available to users on CD-ROM – with one CD of data for each year and each CD costing $10 to send out. An appendix to the study carefully details the expected file size of each variable within the dataset.
Over the years, the NCEP-NCAR dataset has been extended – back to 1948 and forward to 2026. However, as of March this year, the dataset will no longer be updated. This is because its underlying “Climate Data Assimilation System” was discontinued in favour of a newer system.
“For a time, it was truly cutting edge,” Thorne tells Carbon Brief. But, he adds, “I would argue they kept it running for far too long. Newer, better products emerged and the US ceded the leadership role to Europe and Japan, which – to date – they have never recovered.”
The ERA‐Interim reanalysis: configuration and performance of the data assimilation system (2011)
In third place, with a score of 14,226, is a second study about a reanalysis dataset. “The ERA‐Interim reanalysis: configuration and performance of the data assimilation system” was published in the Quarterly Journal of the Royal Meteorological Society in 2011.
The “ERA” reanalysis datasets are those created and maintained by ECMWF, via the EU-funded C3S.
There have been multiple iterations of the ERA datasets, starting with ERA-15, which covered the period 1979-93 and was published in the same early era as the NCEP/NCAR dataset.
This was replaced by ERA-40, which covered 1958-2001, and then ERA-Interim – the focus of this study – and ERA5 (see below).
ERA-Interim was “conceived, in part, to prepare for a future, more ambitious reanalysis project at ECMWF, which will span the entire 20th century”, the authors say in the study:
The “primary goal” for ERA-Interim has been to “address several difficult data assimilation problems encountered during the production of ERA-40”, the study says. These include, for example, the “representation of the hydrological cycle” and the “quality of the stratospheric circulation”.
The resulting dataset covers the period from January 1979 to August 2019. As well as being routinely used in assessments by the World Meteorological Organization (WMO) and the Intergovernmental Panel on Climate Change (IPCC), it has been used in research into everything from warming permafrost and global wildfire danger to mega-heatwave temperatures and atmospheric rivers.
Thorne notes that Europe has “really invested in not just the development of a new reanalysis”, but also the “really important background work” on observational data.
There has been “huge investment in the recovery and preparation of both in-situ and satellite data”, explains Thorne:
“We are talking [about] tens of new satellite data streams and thousands of newly recovered surface meteorological stations. It’s not just a better model that will be making the difference. It’s the wealth of new observations made available through sustained investment and collaboration.”
An overview of CMIP5 and the experiment design (2012)
The publication in fourth place highlights another key building block of global climate research.
As part of the World Climate Research Programme (WCRP), the Coupled Model Intercomparison Project (CMIP) coordinates the work of the climate-modelling community in different institutions across the globe.
The phases of CMIP – timed to align with assessment reports from the Intergovernmental Panel on Climate Change (IPCC) – provide a framework for climate modelling and allow for the results to be collected together and compared.
In fourth place, then, is “An overview of CMIP5 and the experiment design”, published in the Bulletin of the American Meteorological Society in 2012, with a score of 10,034.
CMIP5, the fifth phase of CMIP, produced the model simulations that fed into the IPCC’s fifth assessment reports, published over 2013-14.
This study describes the structure of CMIP5 and the modelling experiments it recommends that groups carry out. This guide would be used by “more than 20 modelling groups…using more than 50 models”, it says.
The paper was written by Dr Karl Taylor at the Lawrence Livermore National Laboratory, Dr Ronald Stouffer, then of the Geophysical Fluid Dynamics Laboratory, and Dr Gerald Meehl from the National Center for Atmospheric Research (NCAR).
(Meehl is ranked fourth in Carbon Brief’s Cosmos 500 ranking of the most highly cited authors.)
At the time, CMIP5 was the largest project of its kind in climate science, Taylor and Stouffer tell Carbon Brief, adding:
“[CMIP5] has produced thousands of peer-reviewed papers, which have had a huge impact on our understanding of future climate changes. Much of governmental and societal actions to reduce the impact of climate change are a result of this activity.”
Compared to its predecessor, Taylor and Stouffer say that CMIP5 included “newer, more comprehensive models – including processes omitted in earlier simulations – [that] were run under a more expansive set of conditions to provide a more complete understanding of future climate change”.
CMIP5 has since been superseded by the sixth phase (CMIP6) and, more recently, the seventh phase (CMIP7) as the IPCC gears up for its seventh assessment cycle.
Global analyses of sea surface temperature, sea ice and night marine air temperature since the late 19th century (2003)
Along with programming languages, reanalysis data and modelling frameworks, another cornerstone of climate research is global observational data.
In fifth place, with a score of 7,597, is “Global analyses of sea surface temperature, sea ice and night marine air temperature since the late nineteenth century”, published in the Journal of Geophysical Research: Atmospheres in 2003.
This publication describes two new datasets produced by the UK’s Met Office Hadley Centre: HadISST1 for sea ice and sea surface temperature; and HadMAT1 for nighttime marine air temperature.
These are global “gridded” datasets, explains lead author Nick Rayner, who leads the climate monitoring and observational climate dataset development work at the Met Office Hadley Centre:
“[The datasets] convert the assembled measurements made over the last 170 or more years by generations of dedicated observers around the world into information that is directly usable for a range of different areas of research.”
HadISST1, for example, provides an “easy-to-use, combined, self-consistent data set of sea surface temperature and sea ice concentration”, Rayner tells Carbon Brief:
“Providing information everywhere, either directly from local measurements or estimated using data-driven statistical relationships, HadISST provides lower boundary information needed for atmosphere-only climate model simulations or dynamical reanalyses, for example.”
These datasets have “been used in many different ways by people across many different disciplines”, she adds.
A later study introducing version 2.1 of HadISST, published in 2014, gave some examples of how the dataset has been used in climate research:
“[It has been] used for the evaluation of coupled atmosphere-ocean climate models…for the forcing of atmospheric models and dynamical reanalyses in the reproduction of recent climate…and in the assessment of model projections. Regular monthly updates also make it an option for climate monitoring, for example, in the monitoring of the summer Arctic sea ice, which is known to be declining at a rapid rate.”
The ERA5 global reanalysis (2020)
In sixth place is a third publication on reanalysis data in the top 10. With a score of 6,781 is “The ERA5 global reanalysis”.
Published in the Quarterly Journal of the Royal Meteorological Society in May 2020, this is also the most recent study across the entire Cosmos 500 ranking.
ERA5 was created as the successor to ERA-Interim (see above), but both are seen as the “gold standards of atmospheric reanalysis”, says Dr Hersbach, the lead author on the ERA5 study. He tells Carbon Brief:
“For ERA5, data is hourly and is easily accessible from the C3S Climate Data Store. In addition, provision of timely updates five days behind real time – together with a 30-year reference – allows for timely and accurate monitoring of the climate system.”
ERA5 has also become a “leading dataset to power the AI weather prediction model revolution”, adds Hersbach.
Thorne agrees that ERA5’s emergence alongside AI and machine-learning weather forecasting techniques “has been truly transformative”.
Described on the C3S website as the organisation’s “flagship dataset”, ERA5 “provides a comprehensive reanalysis of atmospheric, sea surface and land surface conditions for any hour since 1 January 1940 and until only five days behind present”. It adds:
“ERA5 provides one of the most accurate reconstructions of the past weather at any location on our planet.”
A 2024 report for ECMWF on the value generated by ERA5 estimates that, “at the lower end”, the dataset has realised a “combined annual benefit of more than €1bn (£870m)”.
As for what comes next, Hersbach says that his team has “just started the production of ERA6”. This will have “much-enhanced horizontal resolution” of its gridded data – 14km, rather than 31km for ERA5 and 80km for ERA-Interim, he notes.
In addition, says Hersbach, “ERA6 will benefit from yet many more newly reprocessed and rescued observations – both from satellites and in-situ”.
Nonparametric tests against trend (1945)
In seventh place is “Nonparametric tests against trend” with a score of 6,092.
Published in the journal Econometrica back in 1945, this 81-year-old paper is one of the oldest in the Cosmos 500. (The oldest is a Soil Science paper from 1934.)
As with some of the other highly cited studies in the Cosmos 500, this is not directly related to climate change. In fact, the 15-page document is almost entirely composed of equations.
The purpose of the paper, wrote its author Prof Henry Mann – a professor of mathematics at Ohio State University – was to “discuss tests of randomness against trend”. Mann’s ideas were later combined with those of British statistician Maurice Kendall from his 1975 book on rank correlation – see the publication in 20th place below – to form the “Mann-Kendall test”.
The Mann-Kendall test went on to become one of the most-famous methods of identifying trends within timeseries data. The approach is based on the ranking of the data, rather than actual values. This means, explains one hydrology study, the test is “not affected by the actual distribution of the data and is less sensitive to outliers”.
This makes the test particularly useful for detecting increasing or decreasing trends in climate and hydrology data, which can be messy and have trends that are not neatly linear.
The Mann-Kendall test is still widely used today – for example, from identifying increasing land surface temperatures in Turkey to detecting declines in snow cover in India.
River flow forecasting through conceptual models part I – a discussion of principles (1970)
In eighth place, with a citation score of 6,019, is “River flow forecasting through conceptual models part I – a discussion of principles”.
Published in the Journal of Hydrology in 1970, the study introduced a method to evaluate the performance of hydrological models.
This became known as the Nash-Sutcliffe efficiency (NSE) metric, after authors James Eamonn Nash and John Sutcliffe.
Hydrological models are “frequently used to assess climate change impacts, such as floods and droughts”, says Dr Lieke Melsen, associate professor in computational hydrology at Wageningen University in the Netherlands.
Melsen authored a study last year on “the rise” of the NSE. She tells Carbon Brief that the NSE was “proposed in a time when there was a lot of development in computational modeling and the community felt a need to compare and assess all these models”.
Other metrics were proposed at the time, says Melsen, but, “in the end, the NSE emerged as the most dominant”.
The NSE has been criticised, Melsen notes, yet “bad methods don’t stand the test of time, so obviously the NSE proved itself useful, but other methods could have been equally well, or might fit better for some questions or circumstances”.
Model selection and multimodel inference: A practical information-theoretic approach (1998)
In ninth place, with a citation score of 5,983, is another publication with no immediately obvious link to climate research.
It is “Model selection and multimodel inference: A practical information-theoretic approach”, a book originally published in 1998 before being followed by a second edition in 2002.
The book was written by Prof Kenneth Burnham, who is now retired from his positions as a statistician at the Colorado cooperative fish and wildlife research unit at Colorado State University (CSU) and senior scientist at the US Geological Survey (USGS), and Prof David Anderson, who retired from similar positions at both the CSU and USGS before he died in 2020.
The aim of the book is to introduce ways of analysing data according to the selection of a “best” model, the authors explain. Here, “model” simply refers to any mathematical description of how different variables relate to each other.
For example, a regression model is a statistical approach for describing and estimating the relationship between an outcome and one or more variables (or “predictors”) that might influence it.
A review of the book, published in the Journal of Wildlife Management in 2003, explains how this could work in practice:
“Suppose you have a dataset consisting of a response variable and several predictor variables. Suppose you run several different regression models and a few of them result in good predictions…Which model, if any, should you choose?”
The book sets out a “likelihood-information approach”, the review says, which “provides a means of ranking the models from best to worst”.
In addition, Burnham and Anderson advocated not just picking one model, but weighting multiple models according to how well they are supported by the data and then taking an average across them.
This idea of “multimodel inference” – emphasised in the book’s second edition (the term was not in the original title) – is used widely in climate and ecological research.
It is used in detection and attribution of climate change – for example, for identifying the relationship between global temperature and sea levels, and projecting how continued warming will affect wildfires around Yellowstone National Park in the US.
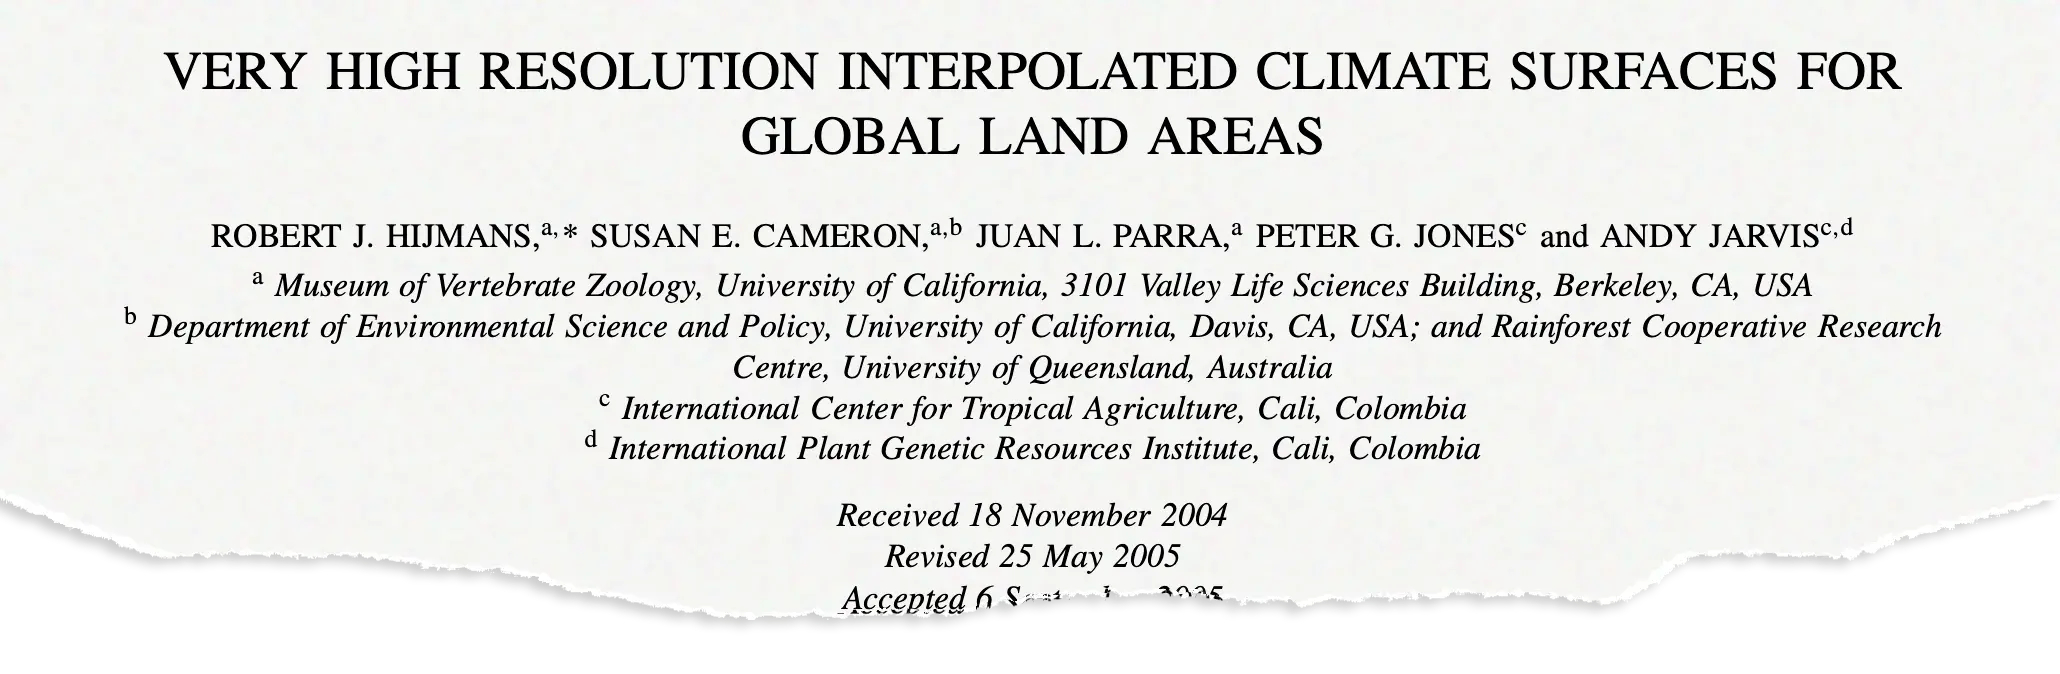
Very high resolution interpolated climate surfaces for global land areas (2005)
Completing the top 10 is another publication presenting climate data. “Very high resolution interpolated climate surfaces for global land areas” was published in the International Journal of Climatology in 2005 and has a score of 5,419.
The study introduced “WorldClim”, an open-access database of high-resolution global weather and climate data.
The publication itself describes the methods the authors used to “compile and interpolate” the data:
“We compiled monthly averages of climate as measured at weather stations from a large number of global, regional, national and local sources, mostly for the 1950-2000 period.”
The authors, led by Prof Robert Hijmans from the University of California, used this data to create “climate surfaces” of monthly temperature and precipitation across the global land area, excluding Antarctica.
This data covers the land surface on a grid with spacing of approximately 1km. This is “400-times higher spatial resolution than previously available surfaces”, the authors say.
In a 2017 blog post to celebrate open-access data, study co-author Dr Andy Jarvis – then a research director at the International Center for Tropical Agriculture (CIAT) – described how the author team had a “simple” idea:
“With more information about temperature and rainfall at a local scale, we could develop better recommendations for farmers and researchers alike.”
The WorldClim dataset “ended up being used by scientists all over the world to tackle challenges we never imagined”, Jarvis wrote:
“From ways to map and control the spread of dengue fever, malaria and Zika virus, to the ideal locations for installing wind and solar power, to habitat conservation for the mountain gorillas of east Africa, the WorldClim data sets were at the core.”
WorldClim 2 was subsequently published in 2017 and expanded the climate variables the database offered to include, among others, solar radiation, wind speed and vapour pressure.
Rest of the top 20
Making up the rest of the top-20 studies in the Cosmos 500 are:
- “Crop evapotranspiration: Guidelines for computing crop water requirements”, a book published by the UN Food and Agriculture Organization in 1998.
- “Decadal trends in the North Atlantic Oscillation: Regional temperatures and precipitation”, published in Science in 1995.
- “Overview of the Coupled Model Intercomparison Project Phase 6 (CMIP6) experimental design and organisation”, published in Geoscientific Model Development in 2016.
- “The ERA‐40 reanalysis”, published in the Quarterly Journal of the Royal Meteorological Society in 2005.
- “A globally coherent fingerprint of climate change impacts across natural systems”, published in Nature in 2003.
- “Estimates of the regression coefficient based on Kendall’s Tau”, published in the Journal of the American Statistical Association in 1968.
- “The value of the world’s ecosystem services and natural capital”, published in Nature in 1997.
- “Statistical methods in the atmospheric sciences”, published in Technometrics in 1996.
- “Biodiversity hotspots for conservation priorities”, published in Nature in 2000.
- “Rank correlation methods”, a book by Maurice G Kendall, first published in 1948 and then followed by multiple later editions.
Top journals
The vast majority of the publications in the Cosmos 500 are studies published in academic journals.
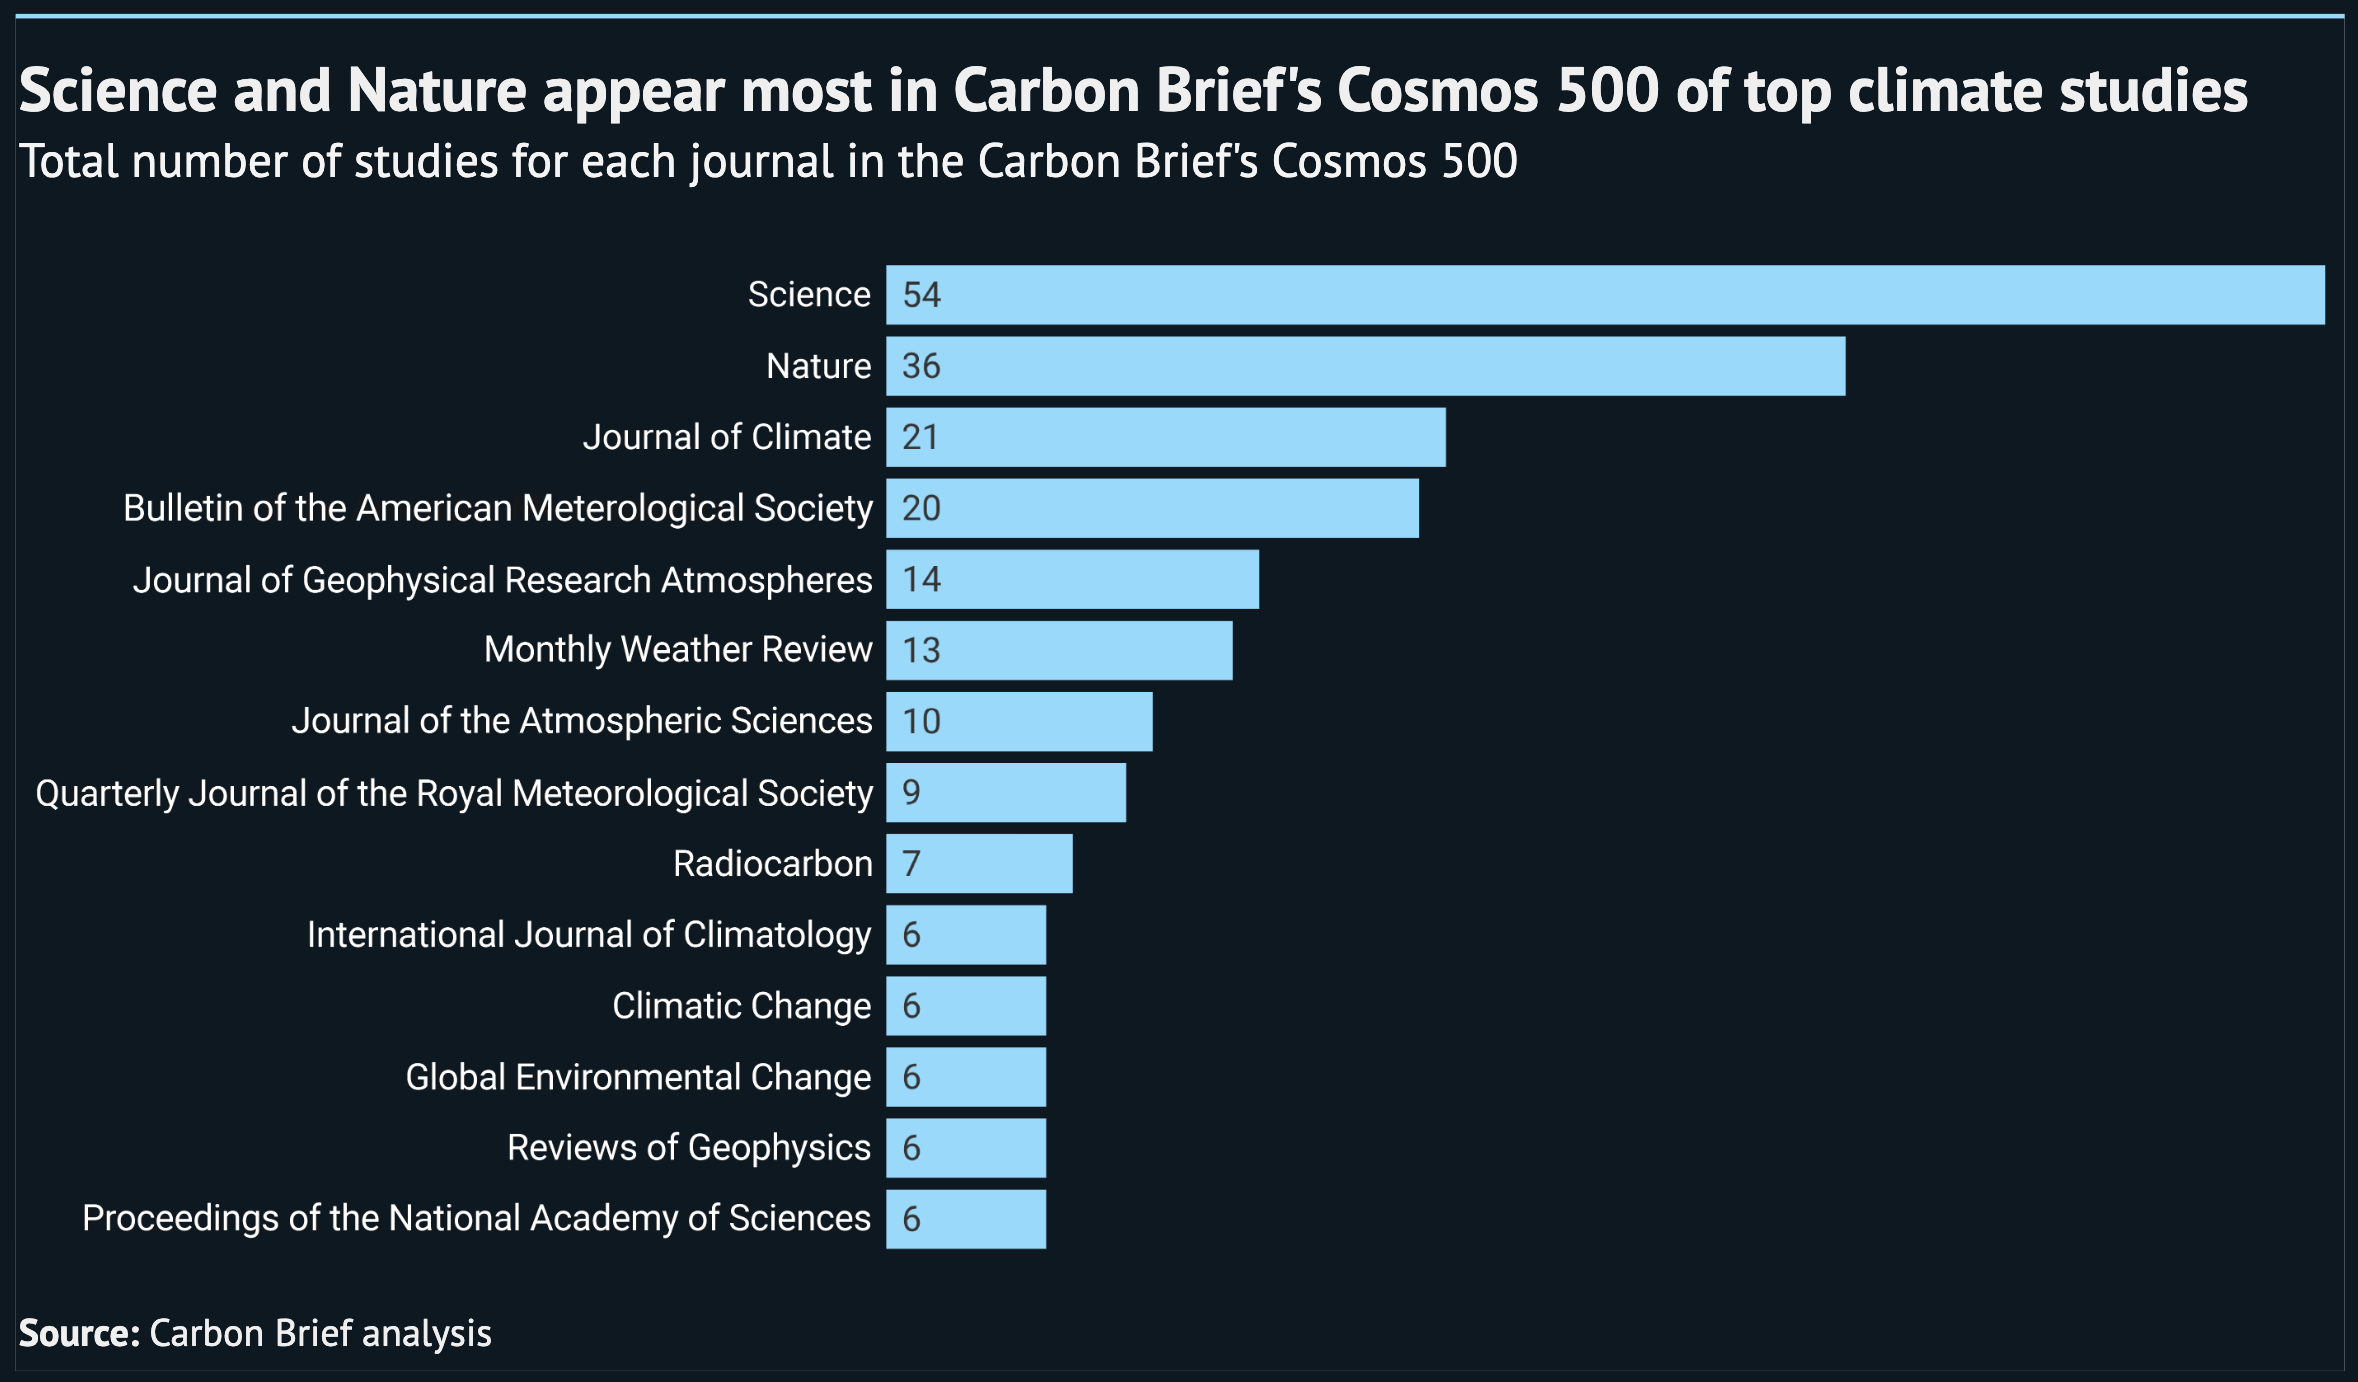
The two journals with the most studies in the Cosmos 500 are among the most prestigious in all of scientific publishing.
Taking top spot, with 54 studies, is Science – beating its rival Nature, which has 36.
Making up the rest of the top five is the Journal of Climate with 21 studies, the Bulletin of the American Meteorological Society (BAMS) with 20 and the Journal of Geophysical Research: Atmospheres (JGR: Atmospheres) with 14.
This means that four of the top five journals are based in the US. Nature is the exception, being a UK-based organisation.
In fact, with Monthly Weather Review in sixth place (13 studies), half of the top six are journals published by the American Meteorological Society (along with the Journal of Climate and BAMS).
The chart below shows the 10 journals (including ties) with the most studies in the Cosmos 500.
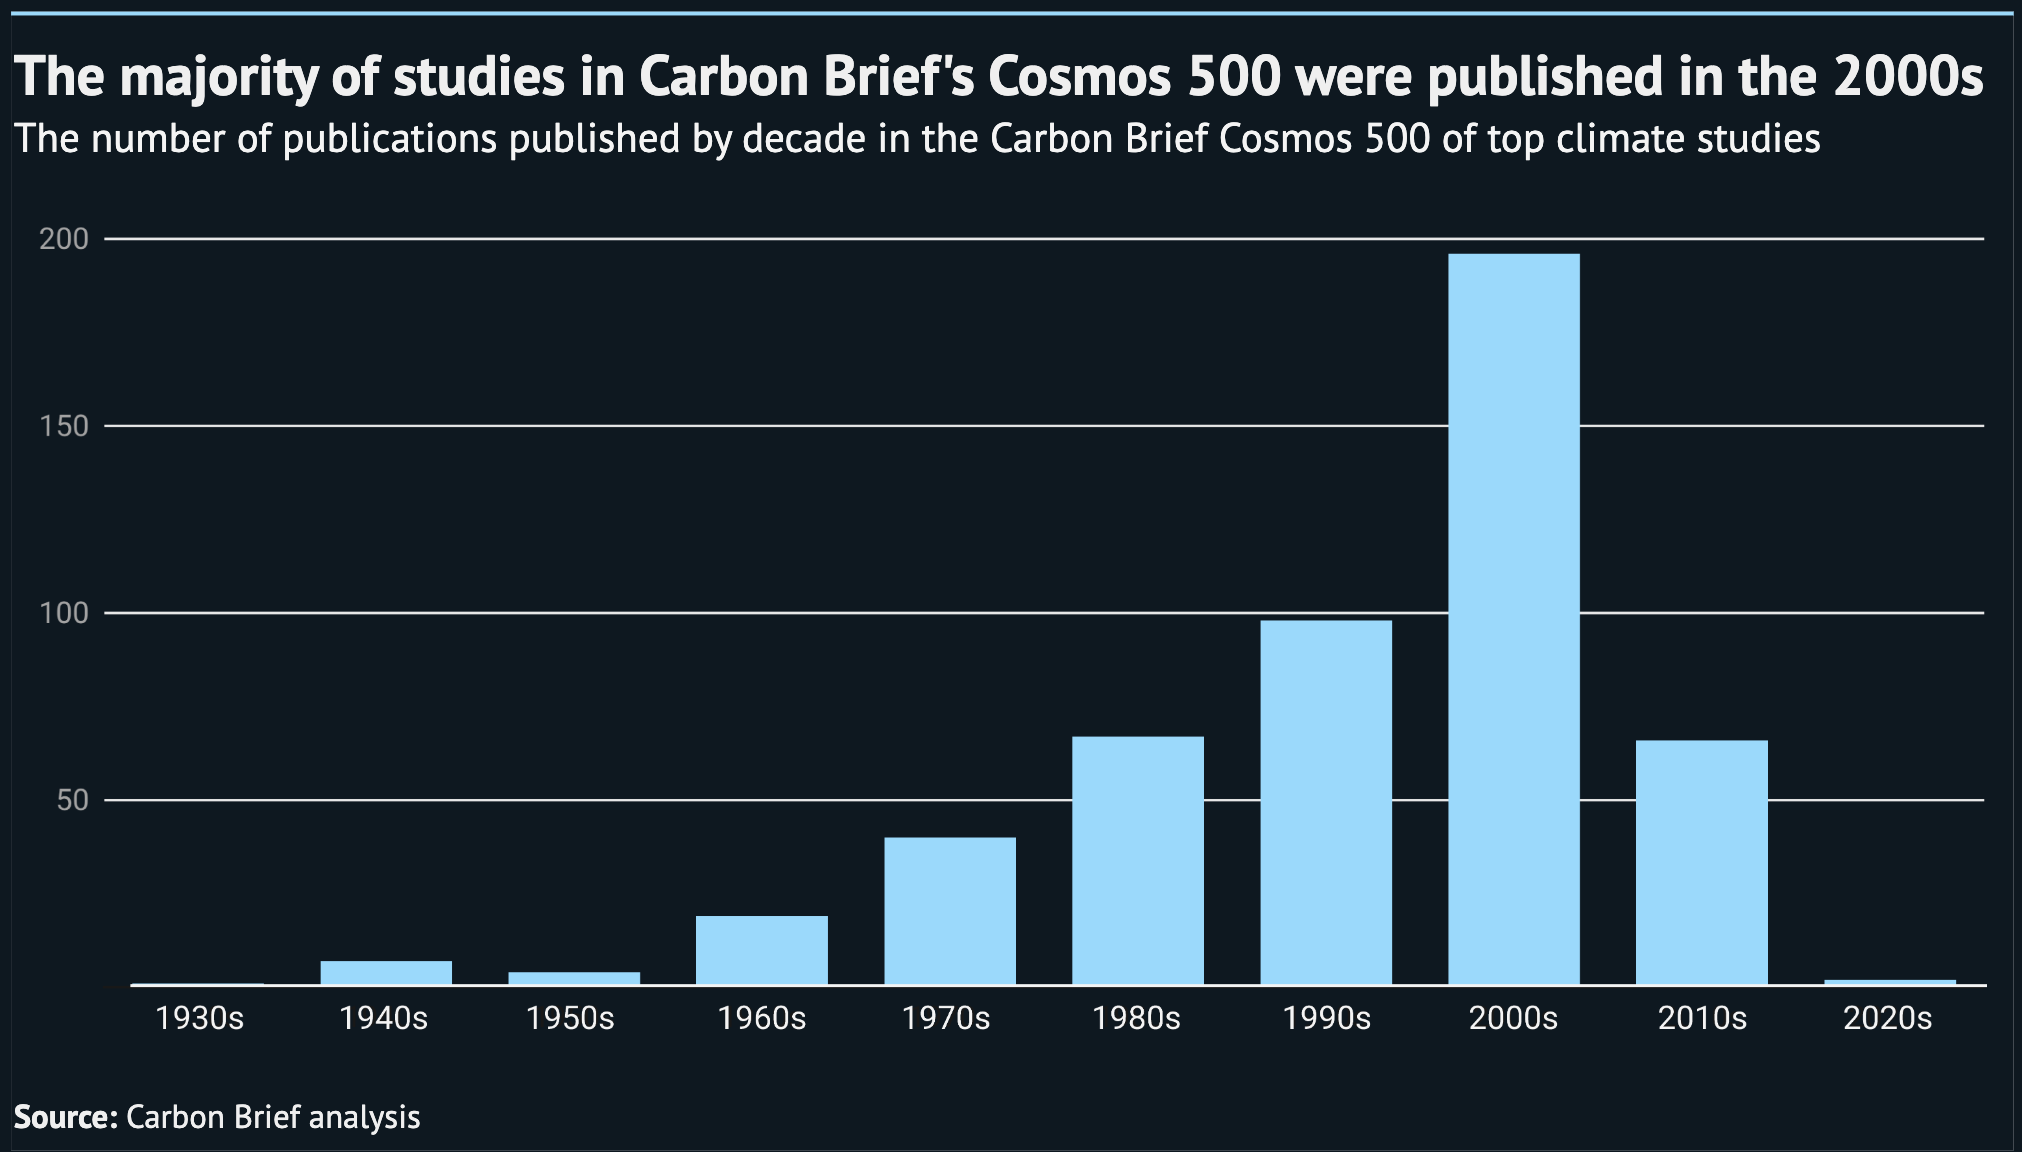
The chart below shows the timeline of Cosmos 500 studies, showing when they were published. As mentioned earlier, the oldest study in the top 500 was published in 1934 and the most recent was published in 2020.
In general, the bulk of the studies were published in the 1990s and 2000s. This is to be expected as it takes time for the citation count for a study to accumulate.
IPCC-only ranking
The Cosmos 500 ranking analyses the full 1.8m publications in Carbon Brief’s universe of climate science.
Carbon Brief has also analysed the 107,000 unique studies, reports and books that are directly referenced across all the IPCC reports published since 1990. This subset of data is known as the “IPCC-only” section of the database.
The full rankings are in the tables that follow, below are the top-three most cited publications in IPCC reports:
First place
Placing first with 37 citations in IPCC reports is “The economics of climate change: The Stern review”, an independent report commissioned by the UK government and published in 2006.
The 700-page report was led by Sir Nicholas Stern, then head of the UK Government Economic Service, at the request of then-chancellor Gordon Brown.
Describing climate change as the “greatest market failure the world has ever seen”, the report’s headline finding was that “there is still time to avoid the worst impacts of climate change, if we take strong action now”.
At the time of publication, Prof Michael Grubb – then professor of climate change and energy policy at Imperial College London and the University of Cambridge – said the report “finally closes a chasm that has existed for 15 years between the precautionary concerns of scientists and the cost-benefit views of many economists”.
Over the 20 years since it was published, the report has been hugely influential. For example, the mitigation report of the IPCC’s fourth assessment (AR4), published in 2007, said:
“From an economic perspective, the Stern review found that in order to minimise the most harmful consequences of climate change, concentrations would need to be stabilised below 550ppm CO2-eq [parts per million of CO2 equivalent].”
The review further argues that any delay in reducing emissions ‘would be costly and dangerous’.”
The latter conclusion, said the IPCC, was “at variance with the conclusions drawn from earlier economic analyses which support a slow ‘ramp up’ of climate policy action”.
Joint second
Following the Stern review are three publications tied on 23 citations within IPCC reports. These are:
- “Potential impact of climate change on world food supply”, published in Nature in 1994.
- “Implications for climate and sea level of revised IPCC emissions scenarios”, published in Nature in 1992.
- “The UN Framework Convention on Climate Change”, published in the Review of European Community & International Environmental Law in 1992.
The rankings
The IPCC-only table includes 479 studies, rather than 500, as there are more than 250 papers tied on a citation score of eight.
Method
To produce these rankings, Carbon Brief defined a metric called the “citation score”. This is the number of times that each academic study, book and report is referenced by the others within the database.
Carbon Brief identified and omitted the IPCC reports and chapters from the final ranking of citation score. This is because their citation score would be substantially higher than that over other publications and would have an outsize influence on the rankings. A key aim of Project Cosmos was to identify and analyse the foundational science that underpins climate knowledge, not the extent to which IPCC reports cite other IPCC reports.
A publication’s citation score only shows how highly cited it is within Project Cosmos. It does not indicate how highly cited the study is in broader academic literature.
See Carbon Brief’s methodology article for more details on how the database was constructed.